|
Download Data (XLS File) |
|
||||||||
|
||||||||
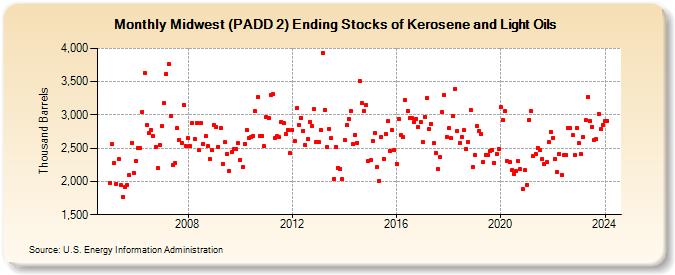
| Midwest (PADD 2) Ending Stocks of Kerosene and Light Oils (Thousand Barrels) | ||||||||
| Year | Jan | Feb | Mar | Apr | May | Jun | Jul | Aug | Sep | Oct | Nov | Dec |
|---|---|---|---|---|---|---|---|---|---|---|---|---|
| 2005 | 1,984 | 2,558 | 2,277 | 1,965 | 2,334 | 1,941 | 1,771 | 1,923 | 1,947 | 2,092 | 2,583 | 2,130 |
| 2006 | 2,303 | 2,497 | 2,499 | 3,051 | 3,633 | 2,845 | 2,731 | 2,769 | 2,682 | 2,523 | 2,204 | 2,543 |
| 2007 | 2,840 | 3,172 | 3,619 | 3,764 | 2,989 | 2,244 | 2,276 | 2,802 | 2,625 | 2,584 | 3,154 | 2,539 |
| 2008 | 2,648 | 2,526 | 2,876 | 2,645 | 2,882 | 2,467 | 2,875 | 2,568 | 2,683 | 2,530 | 2,336 | 2,467 |
| 2009 | 2,842 | 2,811 | 2,524 | 2,801 | 2,269 | 2,588 | 2,409 | 2,161 | 2,437 | 2,482 | 2,492 | 2,573 |
| 2010 | 2,326 | 2,217 | 2,569 | 2,772 | 2,648 | 2,664 | 2,686 | 3,053 | 3,264 | 2,678 | 2,685 | 2,527 |
| 2011 | 2,962 | 2,961 | 3,299 | 3,307 | 2,658 | 2,678 | 2,665 | 2,900 | 2,872 | 2,718 | 2,779 | 2,421 |
| 2012 | 2,774 | 2,610 | 3,098 | 2,851 | 2,960 | 2,765 | 2,550 | 2,640 | 2,898 | 2,829 | 3,085 | 2,596 |
| 2013 | 2,597 | 2,772 | 3,931 | 3,078 | 2,511 | 2,795 | 2,648 | 2,038 | 2,522 | 2,207 | 2,189 | 2,032 |
| 2014 | 2,630 | 2,848 | 2,943 | 3,061 | 2,563 | 2,702 | 2,583 | 3,516 | 3,179 | 3,060 | 3,150 | 2,310 |
| 2015 | 2,317 | 2,608 | 2,727 | 2,211 | 2,012 | 2,671 | 2,340 | 2,711 | 2,902 | 2,463 | 2,777 | 2,474 |
| 2016 | 2,268 | 2,935 | 2,697 | 2,668 | 3,221 | 3,060 | 2,950 | 2,950 | 2,893 | 2,944 | 2,815 | 2,890 |
| 2017 | 2,596 | 2,969 | 3,251 | 2,785 | 2,864 | 2,571 | 2,432 | 2,181 | 2,368 | 3,043 | 3,303 | 2,671 |
| 2018 | 2,796 | 2,646 | 2,985 | 3,397 | 2,755 | 2,575 | 2,665 | 2,770 | 2,485 | 2,590 | 3,079 | 2,214 |
| 2019 | 2,403 | 2,829 | 2,762 | 2,710 | 2,294 | 2,401 | 2,391 | 2,453 | 2,478 | 2,284 | 2,413 | 2,487 |
| 2020 | 3,113 | 2,917 | 3,052 | 2,301 | 2,286 | 2,168 | 2,118 | 2,153 | 2,306 | 2,181 | 1,883 | 2,166 |
| 2021 | 1,954 | 2,930 | 3,054 | 2,388 | 2,413 | 2,504 | 2,467 | 2,341 | 2,266 | 2,287 | 2,591 | 2,740 |
| 2022 | 2,653 | 2,336 | 2,145 | 2,415 | 2,100 | 2,393 | 2,395 | 2,807 | 2,800 | 2,692 | 2,396 | 2,806 |
| 2023 | 2,573 | 2,407 | 2,665 | 2,921 | 3,275 | 2,905 | 2,825 | 2,630 | 2,633 | 3,012 | 2,788 | 2,856 |
| 2024 | 2,915 | |||||||||||
| - = No Data Reported; -- = Not Applicable; NA = Not Available; W = Withheld to avoid disclosure of individual company data. |
| Release Date: 3/29/2024 |
| Next Release Date: 4/30/2024 |