|
Download Data (XLS File) |
|
||||||||
|
||||||||
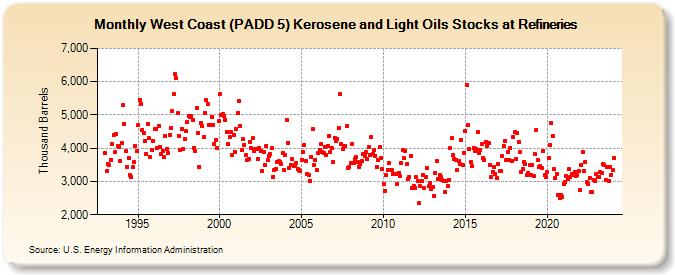
| West Coast (PADD 5) Kerosene and Light Oils Stocks at Refineries (Thousand Barrels) | ||||||||
| Year | Jan | Feb | Mar | Apr | May | Jun | Jul | Aug | Sep | Oct | Nov | Dec |
|---|---|---|---|---|---|---|---|---|---|---|---|---|
| 1993 | 3,845 | 3,324 | 3,536 | 3,492 | 3,647 | 4,116 | 4,404 | 3,877 | 4,413 | 4,060 | 4,030 | 3,618 |
| 1994 | 4,141 | 5,291 | 4,725 | 3,914 | 3,429 | 3,712 | 3,204 | 3,124 | 3,426 | 3,583 | 4,074 | 3,906 |
| 1995 | 4,697 | 5,458 | 5,340 | 4,558 | 4,442 | 4,218 | 3,838 | 4,724 | 4,295 | 3,731 | 3,931 | 4,201 |
| 1996 | 4,568 | 4,572 | 4,016 | 4,663 | 4,038 | 3,831 | 3,930 | 3,728 | 4,370 | 3,983 | 3,850 | 4,401 |
| 1997 | 4,620 | 5,106 | 5,618 | 6,243 | 6,121 | 5,055 | 4,364 | 3,949 | 4,585 | 3,975 | 4,278 | 4,505 |
| 1998 | 4,793 | 4,972 | 4,926 | 4,958 | 4,839 | 4,020 | 3,902 | 5,213 | 4,459 | 3,436 | 4,745 | 4,656 |
| 1999 | 4,348 | 5,061 | 5,438 | 5,343 | 4,709 | 4,708 | 4,929 | 4,705 | 4,127 | 4,258 | 4,012 | 4,807 |
| 2000 | 5,617 | 5,010 | 5,021 | 4,972 | 4,834 | 4,484 | 4,127 | 4,322 | 4,483 | 3,807 | 4,382 | 3,894 |
| 2001 | 4,566 | 5,046 | 5,410 | 4,681 | 3,937 | 4,282 | 4,110 | 3,801 | 3,640 | 3,663 | 4,185 | 4,003 |
| 2002 | 4,307 | 3,909 | 3,971 | 3,988 | 3,674 | 4,005 | 3,930 | 3,309 | 3,895 | 3,496 | 4,080 | 3,636 |
| 2003 | 3,776 | 3,821 | 3,993 | 3,138 | 3,353 | 3,369 | 3,589 | 3,606 | 3,595 | 3,538 | 3,858 | 3,358 |
| 2004 | 3,799 | 4,852 | 4,168 | 3,395 | 3,503 | 3,676 | 3,455 | 3,485 | 3,555 | 3,368 | 3,340 | 3,303 |
| 2005 | 3,659 | 3,886 | 4,094 | 3,601 | 3,227 | 3,181 | 3,025 | 3,735 | 4,567 | 3,491 | 3,653 | 3,338 |
| 2006 | 3,842 | 3,950 | 4,117 | 3,900 | 3,841 | 4,040 | 3,810 | 4,070 | 4,380 | 3,878 | 3,991 | 3,582 |
| 2007 | 4,314 | 4,231 | 4,286 | 4,597 | 5,617 | 4,128 | 3,969 | 4,067 | 4,071 | 4,679 | 3,407 | 3,440 |
| 2008 | 3,546 | 4,120 | 3,561 | 3,686 | 3,724 | 3,587 | 3,444 | 3,532 | 3,621 | 3,815 | 3,778 | 3,891 |
| 2009 | 3,674 | 4,026 | 3,809 | 4,327 | 3,821 | 3,934 | 3,779 | 3,427 | 3,631 | 4,023 | 3,712 | 3,364 |
| 2010 | 2,917 | 2,726 | 3,191 | 3,354 | 3,558 | 3,330 | 3,331 | 3,211 | 3,223 | 3,226 | 2,920 | 3,267 |
| 2011 | 3,149 | 3,540 | 3,958 | 3,697 | 3,919 | 3,525 | 3,069 | 3,144 | 3,775 | 2,789 | 2,871 | 2,813 |
| 2012 | 3,134 | 3,028 | 2,341 | 2,859 | 3,016 | 3,184 | 2,818 | 3,126 | 3,395 | 2,851 | 2,942 | 2,783 |
| 2013 | 2,819 | 2,573 | 3,255 | 3,607 | 3,084 | 3,184 | 3,120 | 3,051 | 3,026 | 2,695 | 3,014 | 2,874 |
| 2014 | 3,047 | 3,991 | 4,296 | 3,805 | 3,677 | 3,658 | 3,339 | 3,621 | 3,513 | 4,251 | 3,487 | 3,868 |
| 2015 | 4,502 | 5,901 | 4,703 | 3,965 | 3,581 | 3,459 | 3,996 | 3,909 | 3,968 | 4,488 | 3,858 | 3,937 |
| 2016 | 4,129 | 3,699 | 3,658 | 4,186 | 4,077 | 4,147 | 3,504 | 3,148 | 3,297 | 3,433 | 3,215 | 3,100 |
| 2017 | 3,532 | 3,324 | 3,327 | 3,757 | 4,070 | 4,215 | 3,655 | 3,899 | 3,656 | 4,006 | 3,629 | 4,349 |
| 2018 | 4,477 | 3,669 | 4,459 | 4,198 | 3,880 | 3,271 | 3,376 | 3,589 | 3,524 | 3,193 | 3,268 | 3,489 |
| 2019 | 3,197 | 3,498 | 3,151 | 3,835 | 4,548 | 3,650 | 3,427 | 3,469 | 3,412 | 3,927 | 3,188 | 3,141 |
| 2020 | 3,279 | 3,690 | 4,092 | 4,753 | 4,356 | 3,372 | 3,105 | 3,226 | 2,602 | 2,497 | 2,607 | 2,532 |
| 2021 | 2,912 | 2,983 | 3,164 | 3,079 | 3,367 | 3,135 | 3,217 | 3,197 | 3,272 | 3,171 | 3,191 | 3,325 |
| 2022 | 2,741 | 3,492 | 3,886 | 3,329 | 3,588 | 2,993 | 2,910 | 3,115 | 2,669 | 2,693 | 3,029 | 3,004 |
| 2023 | 3,228 | 3,146 | 3,121 | 3,273 | 3,254 | 3,531 | 3,509 | 3,033 | 3,420 | 3,012 | 3,443 | 3,204 |
| 2024 | 3,347 | |||||||||||
| - = No Data Reported; -- = Not Applicable; NA = Not Available; W = Withheld to avoid disclosure of individual company data. |
| Release Date: 3/29/2024 |
| Next Release Date: 4/30/2024 |