|
Download Data (XLS File) |
|
||||||||
|
||||||||
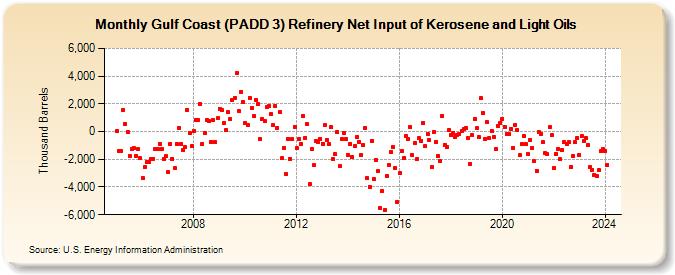
| Gulf Coast (PADD 3) Refinery Net Input of Kerosene and Light Oils (Thousand Barrels) | ||||||||
| Year | Jan | Feb | Mar | Apr | May | Jun | Jul | Aug | Sep | Oct | Nov | Dec |
|---|---|---|---|---|---|---|---|---|---|---|---|---|
| 2005 | 41 | -1,384 | -1,413 | 1,520 | 574 | -41 | -1,746 | -1,270 | -1,205 | -1,755 | -1,278 | -1,934 |
| 2006 | -3,354 | -2,543 | -2,196 | -2,224 | -1,952 | -1,958 | -1,282 | -1,244 | -894 | -1,246 | -2,005 | -1,786 |
| 2007 | -2,953 | -909 | -1,979 | -2,625 | -872 | 259 | -890 | -1,302 | -1,147 | 1,539 | -130 | -1,037 |
| 2008 | 34 | 867 | 825 | 1,958 | -880 | -76 | 845 | 761 | -724 | 841 | -768 | 942 |
| 2009 | 1,632 | 1,532 | 603 | 109 | 1,408 | 903 | 2,283 | 2,456 | 4,213 | 1,463 | 2,861 | 2,134 |
| 2010 | 631 | 481 | 2,425 | 1,678 | 1,120 | 2,307 | 1,990 | -528 | 903 | 774 | 1,767 | 1,870 |
| 2011 | 1,284 | 463 | 1,859 | 289 | 1,379 | -1,937 | -1,178 | -3,060 | -513 | -1,976 | -556 | 358 |
| 2012 | -1,207 | -553 | -865 | 1,119 | -450 | 518 | -3,819 | -1,238 | -2,439 | -655 | -726 | -533 |
| 2013 | -883 | 450 | -620 | -918 | 308 | -1,983 | -1,644 | -44 | -2,505 | -525 | -79 | -540 |
| 2014 | -1,687 | -889 | -1,854 | -1,078 | -401 | -748 | -1,707 | -975 | 278 | -3,361 | -3,972 | -652 |
| 2015 | -3,433 | -2,078 | -2,854 | -5,533 | -4,302 | -5,664 | -3,180 | -2,406 | -1,475 | -1,098 | -2,626 | -5,086 |
| 2016 | -3,010 | -1,417 | -1,933 | -304 | -562 | 338 | -1,711 | -859 | -2,012 | -489 | -668 | 621 |
| 2017 | -1,074 | -180 | -589 | -2,581 | -26 | -768 | -1,774 | -2,130 | 1,152 | -946 | -1,127 | 76 |
| 2018 | -256 | -88 | -410 | -226 | -155 | 64 | 188 | 259 | -473 | -2,333 | -242 | 934 |
| 2019 | 237 | -405 | 2,388 | 1,346 | -522 | 655 | -495 | 59 | -359 | -1,272 | 431 | 622 |
| 2020 | 924 | 351 | -193 | -198 | 207 | -1,152 | 455 | 101 | -1,719 | -867 | -338 | -918 |
| 2021 | -1,631 | -582 | -1,187 | -2,154 | -2,811 | -57 | -181 | -779 | -1,551 | -1,642 | 299 | -280 |
| 2022 | -2,612 | -1,599 | -1,276 | -2,005 | -1,348 | -758 | -898 | -760 | -2,524 | -1,756 | -783 | -460 |
| 2023 | -1,687 | -353 | -656 | -461 | -976 | -2,562 | -2,763 | -3,134 | -3,238 | -2,797 | -1,427 | -1,282 |
| 2024 | -1,438 | |||||||||||
| - = No Data Reported; -- = Not Applicable; NA = Not Available; W = Withheld to avoid disclosure of individual company data. |
| Release Date: 3/29/2024 |
| Next Release Date: 4/30/2024 |