|
Download Data (XLS File) |
|
||||||||
|
||||||||
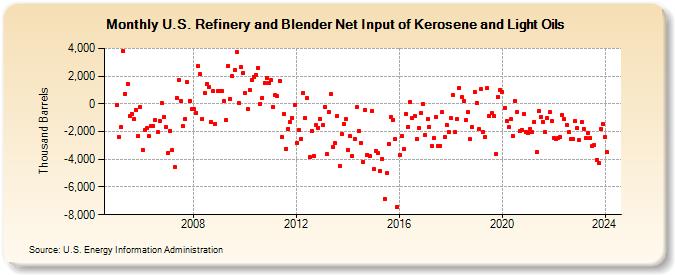
| U.S. Refinery and Blender Net Input of Kerosene and Light Oils (Thousand Barrels) | ||||||||
| Year | Jan | Feb | Mar | Apr | May | Jun | Jul | Aug | Sep | Oct | Nov | Dec |
|---|---|---|---|---|---|---|---|---|---|---|---|---|
| 2005 | -90 | -2,381 | -1,700 | 3,807 | 740 | 1,458 | -889 | -731 | -1,084 | -417 | -2,309 | -264 |
| 2006 | -3,312 | -1,893 | -1,762 | -2,347 | -1,583 | -1,574 | -1,161 | -2,065 | -1,235 | 40 | -943 | -1,662 |
| 2007 | -3,516 | -1,953 | -3,358 | -4,550 | 445 | 1,703 | 182 | -1,606 | -1,065 | 1,541 | 216 | -352 |
| 2008 | -369 | -628 | 2,740 | 2,120 | -1,071 | 755 | 1,436 | 1,200 | -1,333 | 935 | -1,439 | 904 |
| 2009 | 927 | 928 | 212 | -1,155 | 2,738 | 369 | 2,003 | 2,448 | 3,759 | 42 | 2,642 | 2,230 |
| 2010 | 797 | -385 | 982 | 1,740 | 1,960 | 2,111 | 2,617 | 10 | 439 | 1,492 | 1,895 | 1,515 |
| 2011 | 1,693 | -255 | 615 | 534 | 1,678 | -2,392 | -703 | -3,225 | -1,782 | -1,297 | -1,011 | -94 |
| 2012 | -2,807 | -1,894 | -2,530 | 795 | -1,000 | 410 | -3,857 | -1,934 | -3,738 | -1,563 | -1,722 | -1,074 |
| 2013 | -1,560 | -243 | -3,652 | -611 | 691 | -3,119 | -2,839 | -887 | -4,472 | -2,159 | -1,445 | -1,129 |
| 2014 | -3,301 | -2,351 | -3,771 | -2,525 | -262 | -1,940 | -2,808 | -4,204 | -459 | -3,669 | -3,790 | -528 |
| 2015 | -4,732 | -3,370 | -3,579 | -4,831 | -3,956 | -6,837 | -5,014 | -2,895 | -966 | -1,164 | -2,543 | -7,412 |
| 2016 | -3,706 | -2,306 | -3,286 | -710 | -1,640 | 149 | -1,052 | -904 | -2,550 | -1,743 | -638 | -35 |
| 2017 | -2,256 | -1,111 | -1,643 | -3,023 | -2,464 | -940 | -3,047 | -3,018 | -605 | -2,382 | -1,498 | -2,003 |
| 2018 | -1,051 | 611 | -2,039 | -1,083 | 1,172 | 457 | 212 | -1,155 | -596 | -2,558 | -1,689 | 867 |
| 2019 | 66 | -1,818 | 1,040 | -2,008 | -2,412 | 1,133 | -876 | -684 | -907 | -3,629 | 499 | 984 |
| 2020 | 878 | -278 | -1,263 | -1,700 | -1,115 | -2,306 | 228 | -578 | -1,989 | -1,864 | -733 | -2,008 |
| 2021 | -2,111 | -1,831 | -2,032 | -1,286 | -3,486 | -532 | -927 | -1,275 | -2,036 | -1,038 | -606 | -1,230 |
| 2022 | -2,444 | -2,508 | -2,466 | -2,387 | -799 | -1,126 | -1,511 | -2,066 | -2,549 | -2,532 | -1,226 | -1,744 |
| 2023 | -2,622 | -1,326 | -1,784 | -2,471 | -2,077 | -2,447 | -3,077 | -2,960 | -4,019 | -4,267 | -1,828 | -1,466 |
| 2024 | -2,382 | |||||||||||
| - = No Data Reported; -- = Not Applicable; NA = Not Available; W = Withheld to avoid disclosure of individual company data. |
| Release Date: 3/29/2024 |
| Next Release Date: 4/30/2024 |