|
Download Data (XLS File) |
|
||||||||
|
||||||||
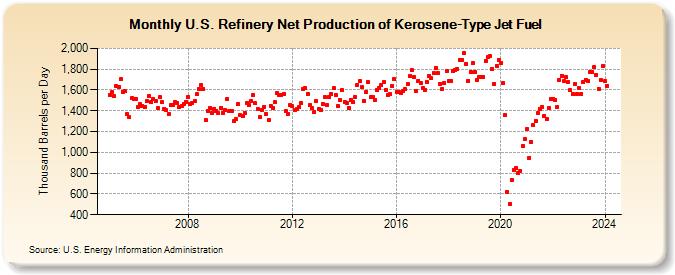
| U.S. Refinery Net Production of Kerosene-Type Jet Fuel (Thousand Barrels per Day) | ||||||||
| Year | Jan | Feb | Mar | Apr | May | Jun | Jul | Aug | Sep | Oct | Nov | Dec |
|---|---|---|---|---|---|---|---|---|---|---|---|---|
| 2005 | 1,552 | 1,576 | 1,541 | 1,638 | 1,631 | 1,701 | 1,585 | 1,590 | 1,368 | 1,337 | 1,520 | 1,515 |
| 2006 | 1,515 | 1,438 | 1,461 | 1,447 | 1,435 | 1,493 | 1,540 | 1,485 | 1,511 | 1,490 | 1,422 | 1,529 |
| 2007 | 1,480 | 1,421 | 1,403 | 1,368 | 1,451 | 1,459 | 1,484 | 1,470 | 1,436 | 1,446 | 1,463 | 1,489 |
| 2008 | 1,535 | 1,467 | 1,475 | 1,492 | 1,558 | 1,605 | 1,647 | 1,609 | 1,312 | 1,401 | 1,425 | 1,383 |
| 2009 | 1,420 | 1,402 | 1,374 | 1,428 | 1,381 | 1,405 | 1,515 | 1,395 | 1,402 | 1,297 | 1,316 | 1,467 |
| 2010 | 1,355 | 1,346 | 1,381 | 1,475 | 1,452 | 1,495 | 1,550 | 1,470 | 1,417 | 1,336 | 1,410 | 1,439 |
| 2011 | 1,372 | 1,313 | 1,446 | 1,426 | 1,482 | 1,570 | 1,553 | 1,548 | 1,564 | 1,397 | 1,371 | 1,454 |
| 2012 | 1,443 | 1,407 | 1,415 | 1,436 | 1,471 | 1,612 | 1,618 | 1,566 | 1,456 | 1,427 | 1,387 | 1,491 |
| 2013 | 1,417 | 1,410 | 1,469 | 1,531 | 1,455 | 1,530 | 1,564 | 1,615 | 1,555 | 1,447 | 1,505 | 1,598 |
| 2014 | 1,489 | 1,470 | 1,431 | 1,507 | 1,480 | 1,531 | 1,648 | 1,685 | 1,628 | 1,497 | 1,584 | 1,675 |
| 2015 | 1,529 | 1,536 | 1,507 | 1,600 | 1,617 | 1,645 | 1,674 | 1,604 | 1,556 | 1,559 | 1,642 | 1,702 |
| 2016 | 1,581 | 1,579 | 1,574 | 1,592 | 1,605 | 1,660 | 1,735 | 1,794 | 1,724 | 1,591 | 1,690 | 1,663 |
| 2017 | 1,618 | 1,604 | 1,676 | 1,737 | 1,712 | 1,762 | 1,814 | 1,761 | 1,661 | 1,611 | 1,670 | 1,784 |
| 2018 | 1,691 | 1,689 | 1,781 | 1,795 | 1,802 | 1,891 | 1,891 | 1,952 | 1,854 | 1,690 | 1,769 | 1,855 |
| 2019 | 1,771 | 1,693 | 1,727 | 1,727 | 1,727 | 1,879 | 1,919 | 1,922 | 1,802 | 1,662 | 1,834 | 1,890 |
| 2020 | 1,855 | 1,667 | 1,358 | 619 | 505 | 733 | 834 | 849 | 799 | 821 | 1,062 | 1,126 |
| 2021 | 1,226 | 949 | 1,101 | 1,262 | 1,306 | 1,380 | 1,420 | 1,432 | 1,353 | 1,319 | 1,423 | 1,511 |
| 2022 | 1,517 | 1,502 | 1,435 | 1,698 | 1,739 | 1,684 | 1,721 | 1,679 | 1,598 | 1,565 | 1,656 | 1,559 |
| 2023 | 1,619 | 1,563 | 1,676 | 1,699 | 1,688 | 1,776 | 1,777 | 1,819 | 1,747 | 1,612 | 1,699 | 1,826 |
| 2024 | 1,690 | |||||||||||
| - = No Data Reported; -- = Not Applicable; NA = Not Available; W = Withheld to avoid disclosure of individual company data. |
| Release Date: 3/29/2024 |
| Next Release Date: 4/30/2024 |