|
Download Data (XLS File) |
|
||||||||
|
||||||||
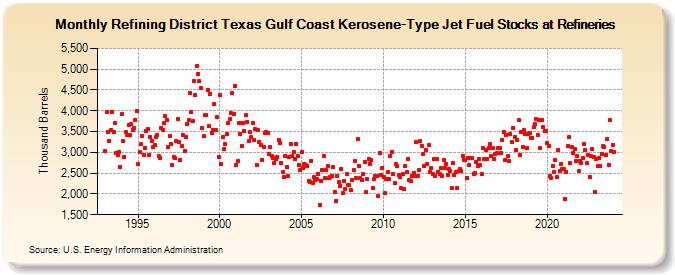
| Refining District Texas Gulf Coast Kerosene-Type Jet Fuel Stocks at Refineries (Thousand Barrels) | ||||||||
| Year | Jan | Feb | Mar | Apr | May | Jun | Jul | Aug | Sep | Oct | Nov | Dec |
|---|---|---|---|---|---|---|---|---|---|---|---|---|
| 1993 | 3,029 | 3,968 | 3,482 | 3,284 | 3,543 | 3,978 | 3,501 | 3,707 | 2,993 | 2,931 | 3,003 | 2,636 |
| 1994 | 3,924 | 3,273 | 2,894 | 3,479 | 3,406 | 3,646 | 3,419 | 3,670 | 3,533 | 3,574 | 3,788 | 3,996 |
| 1995 | 2,713 | 3,009 | 3,193 | 3,404 | 2,948 | 3,111 | 3,514 | 3,553 | 2,945 | 3,364 | 3,268 | 3,118 |
| 1996 | 3,168 | 3,378 | 3,407 | 2,919 | 2,866 | 3,589 | 3,543 | 3,715 | 3,864 | 3,787 | 3,117 | 3,392 |
| 1997 | 3,198 | 2,705 | 2,889 | 2,860 | 3,281 | 3,803 | 3,260 | 2,824 | 3,161 | 3,408 | 3,044 | 3,361 |
| 1998 | 3,689 | 3,776 | 4,436 | 3,964 | 3,749 | 4,707 | 4,374 | 5,082 | 4,895 | 4,704 | 4,555 | 3,597 |
| 1999 | 3,382 | 3,901 | 3,888 | 4,501 | 3,630 | 4,415 | 3,469 | 3,532 | 4,165 | 3,535 | 3,860 | 2,890 |
| 2000 | 4,387 | 2,709 | 3,379 | 3,084 | 3,198 | 3,434 | 3,700 | 3,793 | 3,952 | 4,416 | 3,921 | 4,607 |
| 2001 | 2,687 | 2,796 | 3,704 | 3,452 | 3,153 | 3,713 | 3,516 | 3,887 | 3,734 | 3,265 | 3,480 | 3,358 |
| 2002 | 3,709 | 3,308 | 3,570 | 2,706 | 3,540 | 3,250 | 3,182 | 2,827 | 3,134 | 3,463 | 3,493 | 3,462 |
| 2003 | 2,956 | 3,126 | 2,908 | 2,866 | 2,735 | 2,837 | 2,898 | 3,295 | 3,213 | 2,750 | 2,536 | 2,405 |
| 2004 | 2,917 | 2,648 | 2,431 | 2,892 | 3,211 | 2,922 | 3,009 | 2,848 | 3,194 | 2,924 | 2,691 | 2,582 |
| 2005 | 3,006 | 2,620 | 2,725 | 2,698 | 2,677 | 2,304 | 2,287 | 2,800 | 2,251 | 2,404 | 2,327 | 2,361 |
| 2006 | 2,487 | 1,729 | 2,318 | 2,571 | 2,918 | 2,382 | 2,579 | 2,682 | 2,378 | 2,406 | 2,438 | 2,651 |
| 2007 | 2,047 | 1,836 | 2,432 | 2,287 | 2,186 | 2,606 | 2,026 | 2,316 | 2,112 | 2,468 | 2,207 | 2,206 |
| 2008 | 2,087 | 2,338 | 2,565 | 2,792 | 2,371 | 3,316 | 2,671 | 2,374 | 2,346 | 2,481 | 2,762 | 2,057 |
| 2009 | 2,358 | 2,846 | 2,717 | 2,827 | 2,144 | 2,355 | 2,440 | 2,428 | 1,955 | 2,990 | 2,456 | 2,631 |
| 2010 | 2,404 | 2,017 | 2,352 | 2,523 | 2,369 | 2,911 | 3,014 | 2,485 | 2,262 | 2,730 | 2,678 | 2,456 |
| 2011 | 2,410 | 2,134 | 2,475 | 2,119 | 2,668 | 2,537 | 2,837 | 2,332 | 2,302 | 2,425 | 2,513 | 2,432 |
| 2012 | 3,247 | 2,425 | 2,575 | 3,265 | 3,151 | 2,968 | 2,668 | 3,063 | 2,728 | 3,166 | 2,520 | 2,631 |
| 2013 | 2,473 | 2,851 | 2,439 | 2,831 | 2,533 | 2,476 | 2,613 | 2,428 | 2,817 | 2,631 | 2,711 | 2,465 |
| 2014 | 2,599 | 2,540 | 2,151 | 2,747 | 2,463 | 2,535 | 2,138 | 2,553 | 2,606 | 2,562 | 2,905 | 2,814 |
| 2015 | 2,805 | 2,394 | 2,874 | 2,700 | 2,858 | 2,856 | 2,489 | 2,501 | 2,778 | 2,666 | 2,844 | 2,695 |
| 2016 | 2,472 | 3,113 | 2,850 | 3,060 | 2,845 | 3,100 | 3,189 | 2,908 | 3,112 | 2,848 | 2,970 | 2,978 |
| 2017 | 3,105 | 3,106 | 2,985 | 3,296 | 3,495 | 2,823 | 3,420 | 2,907 | 2,788 | 3,446 | 3,257 | 3,593 |
| 2018 | 3,369 | 3,062 | 3,297 | 3,766 | 2,931 | 3,484 | 3,117 | 3,526 | 3,434 | 3,095 | 3,440 | 3,474 |
| 2019 | 3,343 | 3,341 | 3,599 | 3,675 | 3,790 | 3,428 | 3,788 | 3,112 | 3,781 | 3,612 | 3,522 | 3,506 |
| 2020 | 3,236 | 3,151 | 2,425 | 2,371 | 2,677 | 2,520 | 2,815 | 2,411 | 3,054 | 2,553 | 2,719 | 2,611 |
| 2021 | 2,595 | 1,887 | 2,519 | 3,158 | 3,359 | 2,734 | 3,122 | 2,988 | 3,091 | 2,788 | 2,911 | 2,557 |
| 2022 | 2,780 | 2,748 | 2,872 | 3,206 | 3,058 | 2,739 | 2,940 | 2,417 | 2,907 | 3,084 | 2,888 | 2,041 |
| 2023 | 2,851 | 2,673 | 2,853 | 2,672 | 2,972 | 3,157 | 3,133 | 2,925 | 3,319 | 2,698 | 3,778 | 3,021 |
| 2024 | 3,185 | |||||||||||
| - = No Data Reported; -- = Not Applicable; NA = Not Available; W = Withheld to avoid disclosure of individual company data. |
| Release Date: 3/29/2024 |
| Next Release Date: 4/30/2024 |