|
Download Data (XLS File) |
|
||||||||
|
||||||||
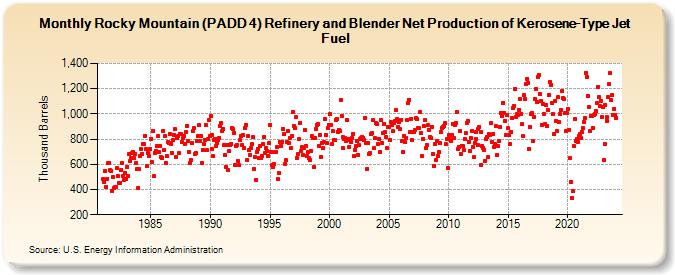
| Rocky Mountain (PADD 4) Refinery and Blender Net Production of Kerosene-Type Jet Fuel (Thousand Barrels) | ||||||||
| Year | Jan | Feb | Mar | Apr | May | Jun | Jul | Aug | Sep | Oct | Nov | Dec |
|---|---|---|---|---|---|---|---|---|---|---|---|---|
| 1981 | 485 | 462 | 546 | 423 | 486 | 607 | 607 | 551 | 544 | 387 | 502 | 415 |
| 1982 | 419 | 421 | 571 | 506 | 449 | 454 | 557 | 610 | 506 | 476 | 531 | 487 |
| 1983 | 581 | 506 | 678 | 624 | 648 | 691 | 696 | 650 | 685 | 611 | 562 | 413 |
| 1984 | 559 | 664 | 722 | 684 | 758 | 758 | 827 | 719 | 590 | 692 | 668 | 723 |
| 1985 | 804 | 620 | 867 | 505 | 689 | 705 | 749 | 823 | 694 | 743 | 661 | 652 |
| 1986 | 867 | 715 | 823 | 610 | 665 | 778 | 773 | 842 | 763 | 688 | 793 | 835 |
| 1987 | 877 | 654 | 810 | 823 | 688 | 843 | 837 | 776 | 805 | 826 | 760 | 858 |
| 1988 | 902 | 786 | 696 | 607 | 633 | 766 | 865 | 887 | 683 | 691 | 784 | 822 |
| 1989 | 910 | 783 | 826 | 607 | 717 | 761 | 795 | 914 | 712 | 799 | 950 | 821 |
| 1990 | 983 | 723 | 831 | 662 | 795 | 803 | 744 | 771 | 793 | 810 | 903 | 926 |
| 1991 | 868 | 881 | 754 | 673 | 580 | 754 | 554 | 703 | 754 | 763 | 890 | 878 |
| 1992 | 851 | 593 | 748 | 752 | 627 | 591 | 790 | 824 | 751 | 833 | 731 | 886 |
| 1993 | 912 | 637 | 827 | 710 | 674 | 726 | 761 | 816 | 559 | 660 | 477 | 697 |
| 1994 | 725 | 651 | 742 | 652 | 667 | 758 | 816 | 692 | 728 | 707 | 668 | 768 |
| 1995 | 914 | 700 | 592 | 579 | 603 | 696 | 698 | 739 | 480 | 531 | 779 | 749 |
| 1996 | 779 | 883 | 840 | 602 | 631 | 780 | 863 | 770 | 810 | 728 | 822 | 1,017 |
| 1997 | 905 | 889 | 977 | 651 | 679 | 798 | 930 | 705 | 734 | 673 | 732 | 873 |
| 1998 | 749 | 665 | 694 | 647 | 635 | 708 | 822 | 806 | 575 | 812 | 881 | 910 |
| 1999 | 917 | 745 | 834 | 661 | 768 | 729 | 774 | 961 | 833 | 767 | 890 | 915 |
| 2000 | 997 | 912 | 760 | 867 | 795 | 795 | 954 | 963 | 859 | 875 | 864 | 1,112 |
| 2001 | 983 | 816 | 727 | 801 | 808 | 784 | 948 | 801 | 740 | 795 | 777 | 807 |
| 2002 | 844 | 667 | 717 | 742 | 781 | 677 | 752 | 801 | 808 | 818 | 809 | 792 |
| 2003 | 969 | 770 | 564 | 770 | 678 | 688 | 843 | 849 | 948 | 727 | 806 | 925 |
| 2004 | 921 | 763 | 803 | 698 | 948 | 770 | 848 | 922 | 855 | 815 | 733 | 895 |
| 2005 | 897 | 793 | 932 | 911 | 861 | 927 | 943 | 1,027 | 958 | 898 | 935 | 880 |
| 2006 | 950 | 786 | 701 | 827 | 775 | 809 | 948 | 1,083 | 1,114 | 858 | 963 | 790 |
| 2007 | 854 | 858 | 871 | 968 | 956 | 890 | 890 | 1,013 | 850 | 667 | 804 | 905 |
| 2008 | 948 | 730 | 750 | 913 | 875 | 818 | 812 | 898 | 683 | 585 | 761 | 632 |
| 2009 | 782 | 669 | 694 | 769 | 853 | 892 | 899 | 907 | 926 | 758 | 799 | 572 |
| 2010 | 832 | 804 | 782 | 832 | 923 | 805 | 912 | 930 | 1,015 | 723 | 740 | 865 |
| 2011 | 684 | 749 | 748 | 711 | 802 | 845 | 930 | 944 | 777 | 709 | 807 | 863 |
| 2012 | 738 | 655 | 769 | 854 | 799 | 753 | 879 | 896 | 858 | 595 | 744 | 732 |
| 2013 | 717 | 629 | 802 | 813 | 658 | 837 | 834 | 924 | 778 | 841 | 736 | 761 |
| 2014 | 900 | 675 | 742 | 781 | 894 | 1,009 | 985 | 1,090 | 1,008 | 946 | 834 | 989 |
| 2015 | 886 | 830 | 764 | 859 | 966 | 1,046 | 1,065 | 1,201 | 979 | 1,001 | 994 | 1,033 |
| 2016 | 1,120 | 1,000 | 919 | 821 | 1,147 | 1,118 | 1,239 | 1,280 | 1,249 | 721 | 898 | 999 |
| 2017 | 1,009 | 783 | 979 | 1,122 | 1,201 | 1,094 | 1,296 | 1,310 | 1,154 | 1,105 | 913 | 1,076 |
| 2018 | 1,002 | 920 | 1,071 | 905 | 1,034 | 1,148 | 1,254 | 1,228 | 1,087 | 1,003 | 837 | 1,101 |
| 2019 | 943 | 868 | 1,131 | 932 | 997 | 1,029 | 1,181 | 1,126 | 1,118 | 1,005 | 867 | 1,005 |
| 2020 | 1,042 | 874 | 647 | 462 | 334 | 389 | 742 | 956 | 781 | 800 | 780 | 827 |
| 2021 | 838 | 808 | 857 | 887 | 936 | 968 | 1,328 | 1,291 | 1,145 | 1,057 | 861 | 985 |
| 2022 | 984 | 888 | 991 | 1,003 | 1,025 | 1,090 | 1,216 | 1,132 | 1,062 | 1,105 | 974 | 1,057 |
| 2023 | 635 | 760 | 1,071 | 946 | 972 | 1,131 | 1,234 | 1,323 | 1,110 | 1,150 | 993 | 1,039 |
| 2024 | 991 | |||||||||||
| - = No Data Reported; -- = Not Applicable; NA = Not Available; W = Withheld to avoid disclosure of individual company data. |
| Release Date: 3/29/2024 |
| Next Release Date: 4/30/2024 |