|
Download Data (XLS File) |
|
||||||||
|
||||||||
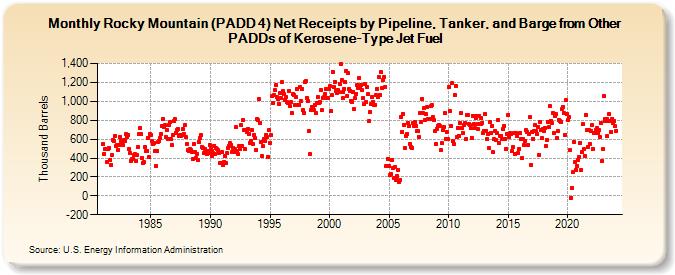
| Rocky Mountain (PADD 4) Net Receipts by Pipeline, Tanker, and Barge from Other PADDs of Kerosene-Type Jet Fuel (Thousand Barrels) | ||||||||
| Year | Jan | Feb | Mar | Apr | May | Jun | Jul | Aug | Sep | Oct | Nov | Dec |
|---|---|---|---|---|---|---|---|---|---|---|---|---|
| 1981 | 549 | 444 | 496 | 493 | 354 | 493 | 509 | 378 | 326 | 433 | 590 | 577 |
| 1982 | 637 | 522 | 540 | 486 | 538 | 627 | 585 | 572 | 534 | 592 | 578 | 656 |
| 1983 | 620 | 644 | 500 | 456 | 367 | 387 | 389 | 431 | 438 | 371 | 431 | 519 |
| 1984 | 650 | 715 | 651 | 403 | 346 | 353 | 515 | 478 | 473 | 612 | 408 | 649 |
| 1985 | 644 | 579 | 552 | 563 | 469 | 316 | 474 | 570 | 584 | 608 | 656 | 739 |
| 1986 | 813 | 731 | 749 | 623 | 700 | 604 | 744 | 777 | 603 | 538 | 647 | 793 |
| 1987 | 809 | 669 | 694 | 712 | 633 | 647 | 630 | 639 | 706 | 659 | 747 | 620 |
| 1988 | 543 | 484 | 479 | 494 | 484 | 468 | 388 | 549 | 464 | 404 | 447 | 382 |
| 1989 | 568 | 613 | 641 | 519 | 506 | 448 | 496 | 450 | 441 | 473 | 452 | 541 |
| 1990 | 495 | 420 | 472 | 449 | 532 | 444 | 502 | 492 | 480 | 457 | 351 | 351 |
| 1991 | 459 | 329 | 361 | 417 | 342 | 450 | 511 | 530 | 556 | 540 | 467 | 508 |
| 1992 | 462 | 498 | 724 | 478 | 438 | 528 | 493 | 747 | 526 | 800 | 692 | 492 |
| 1993 | 692 | 679 | 712 | 653 | 564 | 583 | 695 | 548 | 642 | 607 | 484 | 813 |
| 1994 | 799 | 1,023 | 768 | 569 | 416 | 526 | 605 | 576 | 647 | 627 | 415 | 691 |
| 1995 | 557 | 645 | 1,054 | 985 | 1,066 | 1,119 | 1,170 | 1,045 | 1,026 | 974 | 1,091 | 1,040 |
| 1996 | 1,201 | 1,105 | 1,077 | 1,014 | 1,045 | 994 | 986 | 1,109 | 947 | 988 | 881 | 1,082 |
| 1997 | 1,071 | 966 | 1,050 | 1,132 | 958 | 965 | 1,154 | 1,004 | 1,134 | 904 | 877 | 1,203 |
| 1998 | 1,211 | 1,035 | 1,004 | 684 | 439 | 905 | 943 | 937 | 913 | 963 | 877 | 987 |
| 1999 | 1,047 | 979 | 995 | 1,120 | 904 | 1,038 | 1,041 | 1,075 | 1,130 | 1,040 | 1,040 | 1,133 |
| 2000 | 1,159 | 896 | 1,064 | 1,313 | 1,147 | 1,209 | 1,109 | 1,089 | 1,121 | 1,098 | 1,185 | 1,392 |
| 2001 | 1,225 | 1,030 | 1,101 | 1,132 | 1,199 | 1,318 | 1,056 | 1,298 | 1,129 | 1,114 | 1,007 | 993 |
| 2002 | 1,100 | 915 | 1,030 | 1,077 | 1,176 | 1,143 | 1,247 | 1,151 | 1,173 | 1,119 | 1,035 | 970 |
| 2003 | 1,180 | 996 | 1,150 | 1,076 | 794 | 890 | 970 | 1,049 | 997 | 960 | 966 | 1,062 |
| 2004 | 1,134 | 1,042 | 1,255 | 1,071 | 1,305 | 1,137 | 1,223 | 1,262 | 1,153 | 312 | 313 | 394 |
| 2005 | 314 | 217 | 228 | 374 | 297 | 186 | 304 | 171 | 206 | 277 | 149 | 172 |
| 2006 | 839 | 678 | 870 | 752 | 510 | 637 | 656 | 770 | 740 | 553 | 521 | 508 |
| 2007 | 768 | 742 | 786 | 741 | 689 | 684 | 623 | 879 | 785 | 1,027 | 871 | 928 |
| 2008 | 803 | 863 | 935 | 813 | 809 | 808 | 945 | 959 | 837 | 806 | 682 | 548 |
| 2009 | 706 | 736 | 750 | 741 | 480 | 557 | 695 | 730 | 872 | 600 | 675 | 606 |
| 2010 | 1,149 | 899 | 736 | 1,189 | 579 | 544 | 1,069 | 1,166 | 623 | 721 | 637 | 766 |
| 2011 | 877 | 721 | 665 | 745 | 774 | 597 | 855 | 858 | 759 | 745 | 719 | 615 |
| 2012 | 847 | 756 | 713 | 822 | 849 | 712 | 756 | 849 | 756 | 821 | 773 | 660 |
| 2013 | 686 | 863 | 684 | 599 | 651 | 502 | 785 | 662 | 743 | 459 | 597 | 686 |
| 2014 | 586 | 661 | 803 | 562 | 630 | 631 | 596 | 704 | 741 | 603 | 496 | 659 |
| 2015 | 859 | 624 | 662 | 654 | 470 | 512 | 663 | 439 | 669 | 629 | 451 | 496 |
| 2016 | 664 | 600 | 400 | 605 | 535 | 581 | 691 | 678 | 542 | 656 | 830 | 329 |
| 2017 | 680 | 604 | 683 | 753 | 681 | 656 | 732 | 436 | 776 | 694 | 611 | 705 |
| 2018 | 688 | 718 | 528 | 594 | 785 | 727 | 949 | 795 | 766 | 880 | 664 | 849 |
| 2019 | 863 | 613 | 686 | 806 | 793 | 785 | 921 | 942 | 880 | 644 | 1,010 | 869 |
| 2020 | 801 | 836 | 481 | -20 | 80 | 247 | 570 | 354 | 275 | 311 | 379 | 412 |
| 2021 | 562 | 277 | 462 | 755 | 493 | 424 | 857 | 692 | 516 | 695 | 551 | 682 |
| 2022 | 746 | 496 | 668 | 668 | 696 | 713 | 660 | 691 | 626 | 775 | 368 | 491 |
| 2023 | 1,054 | 787 | 816 | 817 | 629 | 792 | 868 | 788 | 679 | 814 | 768 | 791 |
| 2024 | 734 | |||||||||||
| - = No Data Reported; -- = Not Applicable; NA = Not Available; W = Withheld to avoid disclosure of individual company data. |
| Release Date: 3/29/2024 |
| Next Release Date: 4/30/2024 |