|
Download Data (XLS File) |
|
||||||||
|
||||||||
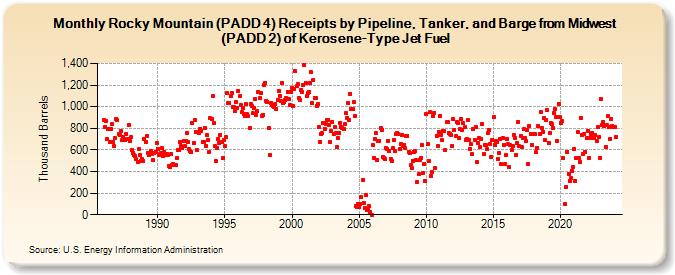
| Rocky Mountain (PADD 4) Receipts by Pipeline, Tanker, and Barge from Midwest (PADD 2) of Kerosene-Type Jet Fuel (Thousand Barrels) | ||||||||
| Year | Jan | Feb | Mar | Apr | May | Jun | Jul | Aug | Sep | Oct | Nov | Dec |
|---|---|---|---|---|---|---|---|---|---|---|---|---|
| 1986 | 881 | 816 | 869 | 700 | 792 | 673 | 790 | 839 | 671 | 633 | 714 | 886 |
| 1987 | 874 | 751 | 735 | 772 | 691 | 721 | 701 | 690 | 750 | 705 | 827 | 682 |
| 1988 | 717 | 597 | 575 | 555 | 542 | 513 | 487 | 606 | 550 | 497 | 513 | 498 |
| 1989 | 703 | 673 | 730 | 575 | 553 | 560 | 592 | 560 | 504 | 574 | 585 | 664 |
| 1990 | 608 | 554 | 566 | 573 | 614 | 545 | 585 | 550 | 559 | 549 | 453 | 441 |
| 1991 | 560 | 456 | 473 | 463 | 461 | 529 | 603 | 600 | 672 | 633 | 621 | 687 |
| 1992 | 632 | 684 | 753 | 673 | 604 | 586 | 581 | 851 | 660 | 877 | 769 | 600 |
| 1993 | 764 | 760 | 797 | 778 | 677 | 676 | 806 | 639 | 735 | 696 | 583 | 891 |
| 1994 | 890 | 1,096 | 845 | 633 | 495 | 614 | 700 | 663 | 742 | 674 | 523 | 695 |
| 1995 | 633 | 716 | 1,126 | 1,035 | 1,034 | 1,096 | 1,125 | 999 | 994 | 962 | 1,047 | 986 |
| 1996 | 1,144 | 1,095 | 1,016 | 950 | 992 | 936 | 916 | 1,021 | 928 | 913 | 805 | 1,028 |
| 1997 | 1,011 | 939 | 985 | 1,072 | 919 | 957 | 1,132 | 1,076 | 1,125 | 916 | 925 | 1,199 |
| 1998 | 1,220 | 1,054 | 1,043 | 799 | 554 | 1,033 | 1,014 | 1,006 | 995 | 1,022 | 981 | 1,063 |
| 1999 | 1,146 | 1,101 | 1,055 | 1,221 | 1,035 | 1,042 | 1,060 | 1,080 | 1,136 | 1,069 | 1,018 | 1,138 |
| 2000 | 1,174 | 1,007 | 1,160 | 1,327 | 1,187 | 1,210 | 1,081 | 1,059 | 1,155 | 1,137 | 1,197 | 1,383 |
| 2001 | 1,223 | 1,095 | 1,123 | 1,132 | 1,220 | 1,317 | 1,036 | 1,248 | 1,084 | 1,085 | 1,010 | 1,027 |
| 2002 | 808 | 675 | 745 | 752 | 853 | 798 | 838 | 878 | 878 | 835 | 677 | 774 |
| 2003 | 862 | 748 | 810 | 752 | 624 | 714 | 756 | 853 | 809 | 804 | 792 | 837 |
| 2004 | 939 | 899 | 1,030 | 880 | 1,120 | 981 | 982 | 1,040 | 916 | 80 | 69 | 96 |
| 2005 | 68 | 99 | 166 | 324 | 113 | 60 | 180 | 45 | 56 | 78 | 22 | 0 |
| 2006 | 646 | 528 | 702 | 756 | 504 | 682 | 687 | 802 | 780 | 536 | 521 | 513 |
| 2007 | 615 | 608 | 687 | 591 | 516 | 493 | 613 | 695 | 586 | 751 | 757 | 747 |
| 2008 | 604 | 656 | 741 | 639 | 646 | 614 | 730 | 733 | 584 | 567 | 462 | 430 |
| 2009 | 493 | 579 | 588 | 504 | 303 | 374 | 508 | 528 | 646 | 388 | 474 | 315 |
| 2010 | 931 | 653 | 496 | 948 | 361 | 392 | 913 | 945 | 429 | 731 | 637 | 766 |
| 2011 | 917 | 741 | 691 | 775 | 774 | 597 | 855 | 858 | 759 | 745 | 741 | 639 |
| 2012 | 883 | 784 | 725 | 858 | 849 | 712 | 792 | 887 | 786 | 845 | 809 | 696 |
| 2013 | 699 | 880 | 696 | 611 | 651 | 559 | 797 | 693 | 808 | 484 | 660 | 710 |
| 2014 | 624 | 699 | 841 | 562 | 645 | 646 | 606 | 752 | 785 | 652 | 535 | 694 |
| 2015 | 900 | 646 | 684 | 676 | 518 | 568 | 705 | 466 | 706 | 644 | 471 | 550 |
| 2016 | 703 | 653 | 444 | 645 | 595 | 635 | 742 | 714 | 554 | 668 | 862 | 632 |
| 2017 | 730 | 627 | 714 | 791 | 711 | 686 | 788 | 473 | 821 | 750 | 649 | 744 |
| 2018 | 748 | 747 | 577 | 618 | 819 | 749 | 949 | 807 | 766 | 892 | 688 | 881 |
| 2019 | 965 | 666 | 755 | 848 | 840 | 807 | 943 | 976 | 908 | 687 | 1,028 | 905 |
| 2020 | 845 | 872 | 525 | 100 | 259 | 585 | 381 | 313 | 338 | 404 | 439 | |
| 2021 | 609 | 314 | 524 | 770 | 521 | 484 | 893 | 736 | 563 | 751 | 579 | 710 |
| 2022 | 775 | 528 | 708 | 748 | 758 | 740 | 710 | 735 | 684 | 813 | 721 | 528 |
| 2023 | 1,074 | 834 | 858 | 818 | 630 | 827 | 911 | 815 | 700 | 885 | 820 | 809 |
| 2024 | 812 | |||||||||||
| - = No Data Reported; -- = Not Applicable; NA = Not Available; W = Withheld to avoid disclosure of individual company data. |
| Release Date: 3/29/2024 |
| Next Release Date: 4/30/2024 |