|
Download Data (XLS File) |
|
||||||||
|
||||||||
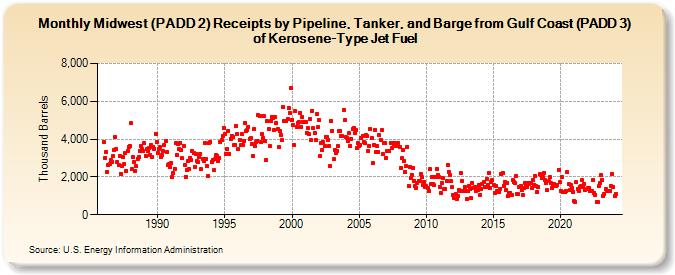
| Midwest (PADD 2) Receipts by Pipeline, Tanker, and Barge from Gulf Coast (PADD 3) of Kerosene-Type Jet Fuel (Thousand Barrels) | ||||||||
| Year | Jan | Feb | Mar | Apr | May | Jun | Jul | Aug | Sep | Oct | Nov | Dec |
|---|---|---|---|---|---|---|---|---|---|---|---|---|
| 1986 | 3,847 | 3,021 | 3,321 | 2,263 | 2,635 | 2,686 | 2,872 | 2,789 | 3,081 | 3,398 | 4,104 | 3,459 |
| 1987 | 2,776 | 2,650 | 3,101 | 2,168 | 2,602 | 3,035 | 2,683 | 3,266 | 2,329 | 3,396 | 3,595 | 3,652 |
| 1988 | 4,831 | 2,399 | 3,043 | 2,800 | 2,334 | 2,556 | 2,971 | 3,074 | 3,390 | 3,616 | 3,481 | 3,362 |
| 1989 | 3,788 | 3,132 | 3,451 | 3,358 | 3,535 | 3,144 | 3,691 | 3,061 | 3,574 | 3,493 | 4,280 | 3,872 |
| 1990 | 3,267 | 3,496 | 3,578 | 3,039 | 3,161 | 3,344 | 3,676 | 3,881 | 3,297 | 2,612 | 2,662 | 2,546 |
| 1991 | 2,746 | 2,012 | 2,184 | 2,419 | 3,788 | 3,159 | 3,734 | 3,453 | 3,796 | 3,411 | 2,978 | 3,641 |
| 1992 | 2,634 | 2,014 | 2,368 | 2,862 | 2,423 | 3,020 | 2,899 | 3,370 | 3,260 | 2,540 | 3,236 | 2,832 |
| 1993 | 2,798 | 3,068 | 3,222 | 2,398 | 2,958 | 2,851 | 3,798 | 2,947 | 2,566 | 2,055 | 3,788 | 3,870 |
| 1994 | 2,796 | 2,909 | 2,343 | 2,927 | 3,135 | 3,127 | 2,854 | 3,022 | 3,851 | 3,927 | 4,156 | 4,590 |
| 1995 | 4,257 | 3,232 | 3,458 | 4,442 | 3,230 | 4,026 | 4,167 | 4,108 | 3,677 | 3,675 | 4,717 | 4,262 |
| 1996 | 3,462 | 3,965 | 3,668 | 4,267 | 3,665 | 3,910 | 4,877 | 4,421 | 4,476 | 4,657 | 4,009 | 4,040 |
| 1997 | 3,742 | 3,106 | 4,524 | 3,634 | 3,870 | 3,922 | 5,252 | 5,223 | 3,850 | 4,279 | 4,066 | 5,230 |
| 1998 | 3,875 | 2,899 | 4,953 | 4,516 | 3,615 | 4,953 | 5,145 | 5,121 | 4,492 | 5,153 | 4,855 | 4,511 |
| 1999 | 3,579 | 4,423 | 4,226 | 3,939 | 5,709 | 4,956 | 4,963 | 4,947 | 5,050 | 5,641 | 5,391 | 6,702 |
| 2000 | 4,997 | 4,769 | 3,691 | 5,474 | 4,634 | 4,852 | 4,922 | 5,398 | 4,655 | 5,149 | 4,929 | 4,914 |
| 2001 | 4,919 | 4,348 | 4,588 | 4,260 | 5,045 | 3,926 | 5,487 | 4,579 | 4,338 | 3,953 | 5,332 | 4,618 |
| 2002 | 5,010 | 3,092 | 3,772 | 3,431 | 3,822 | 3,625 | 4,101 | 4,089 | 3,966 | 3,631 | 2,572 | 4,980 |
| 2003 | 4,442 | 2,933 | 3,437 | 3,257 | 3,373 | 3,614 | 4,418 | 4,450 | 4,167 | 4,149 | 5,554 | 5,006 |
| 2004 | 4,119 | 4,064 | 3,902 | 4,297 | 3,661 | 4,006 | 4,538 | 4,591 | 4,339 | 4,494 | 3,513 | 3,774 |
| 2005 | 3,646 | 3,685 | 4,069 | 4,172 | 3,869 | 3,809 | 4,223 | 4,158 | 3,391 | 3,648 | 4,535 | 4,066 |
| 2006 | 2,726 | 3,704 | 4,492 | 3,293 | 3,648 | 3,318 | 4,196 | 3,961 | 4,472 | 3,199 | 3,781 | 3,779 |
| 2007 | 3,013 | 3,374 | 3,362 | 3,367 | 3,802 | 3,512 | 3,788 | 3,719 | 3,805 | 3,623 | 3,750 | 3,795 |
| 2008 | 3,585 | 2,474 | 2,979 | 3,442 | 2,837 | 2,278 | 2,582 | 3,583 | 1,531 | 2,545 | 1,967 | 2,102 |
| 2009 | 2,470 | 1,802 | 1,545 | 1,414 | 1,701 | 1,803 | 1,777 | 2,163 | 1,971 | 1,574 | 1,720 | 1,472 |
| 2010 | 1,517 | 1,396 | 1,239 | 2,402 | 1,607 | 2,015 | 1,631 | 1,558 | 1,979 | 2,435 | 2,104 | 2,016 |
| 2011 | 1,483 | 1,140 | 1,695 | 1,919 | 1,373 | 1,354 | 1,770 | 2,622 | 2,276 | 2,115 | 1,763 | 1,441 |
| 2012 | 1,067 | 870 | 1,098 | 854 | 972 | 1,305 | 1,259 | 2,190 | 1,776 | 1,240 | 1,476 | 1,241 |
| 2013 | 841 | 1,260 | 1,526 | 1,365 | 873 | 1,703 | 1,408 | 1,467 | 1,278 | 1,409 | 1,291 | 1,561 |
| 2014 | 1,046 | 1,362 | 1,605 | 1,710 | 1,464 | 1,462 | 1,895 | 1,589 | 2,227 | 1,430 | 1,737 | 1,820 |
| 2015 | 1,553 | 1,171 | 1,519 | 1,248 | 1,218 | 1,185 | 1,385 | 2,135 | 2,208 | 1,529 | 1,752 | 1,303 |
| 2016 | 1,684 | 982 | 1,148 | 1,167 | 1,027 | 1,849 | 1,722 | 1,655 | 2,030 | 1,100 | 1,081 | 1,481 |
| 2017 | 1,529 | 1,281 | 1,058 | 1,406 | 1,682 | 1,627 | 1,451 | 1,681 | 1,644 | 1,659 | 1,410 | 1,824 |
| 2018 | 1,587 | 2,036 | 1,496 | 1,209 | 1,466 | 2,133 | 2,084 | 1,954 | 2,012 | 2,232 | 1,824 | 1,701 |
| 2019 | 1,318 | 1,763 | 1,970 | 1,661 | 1,405 | 1,549 | 1,615 | 1,563 | 1,507 | 1,583 | 2,385 | 1,741 |
| 2020 | 1,256 | 2,001 | 1,189 | 1,212 | 1,200 | 1,257 | 2,235 | 1,602 | 1,321 | 1,574 | 1,410 | 1,208 |
| 2021 | 721 | 675 | 1,723 | 1,378 | 1,253 | 1,487 | 1,501 | 1,822 | 1,489 | 1,642 | 1,322 | 1,344 |
| 2022 | 1,405 | 1,426 | 1,233 | 1,248 | 1,240 | 1,849 | 1,174 | 1,047 | 668 | 662 | 1,495 | 1,660 |
| 2023 | 2,079 | 1,837 | 1,016 | 1,122 | 1,348 | 1,240 | 1,275 | 1,244 | 1,248 | 1,523 | 2,172 | 1,441 |
| 2024 | 999 | |||||||||||
| - = No Data Reported; -- = Not Applicable; NA = Not Available; W = Withheld to avoid disclosure of individual company data. |
| Release Date: 3/29/2024 |
| Next Release Date: 4/30/2024 |