|
Download Data (XLS File) |
|
||||||||
|
||||||||
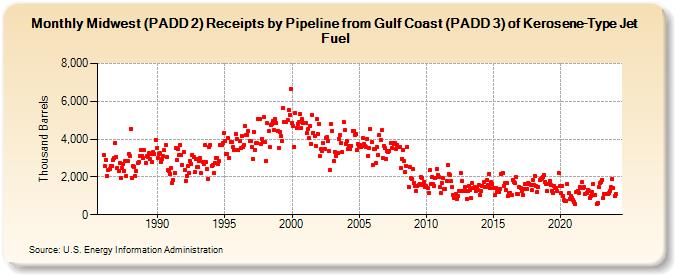
| Midwest (PADD 2) Receipts by Pipeline from Gulf Coast (PADD 3) of Kerosene-Type Jet Fuel (Thousand Barrels) | ||||||||
| Year | Jan | Feb | Mar | Apr | May | Jun | Jul | Aug | Sep | Oct | Nov | Dec |
|---|---|---|---|---|---|---|---|---|---|---|---|---|
| 1986 | 3,134 | 2,562 | 2,909 | 2,030 | 2,353 | 2,413 | 2,571 | 2,565 | 2,887 | 2,981 | 3,796 | 3,079 |
| 1987 | 2,463 | 2,302 | 2,753 | 1,952 | 2,474 | 2,675 | 2,327 | 2,867 | 2,061 | 2,860 | 3,222 | 3,129 |
| 1988 | 4,549 | 1,954 | 2,601 | 2,542 | 2,043 | 2,304 | 2,737 | 2,793 | 3,103 | 3,397 | 3,119 | 3,012 |
| 1989 | 3,410 | 2,744 | 3,095 | 3,044 | 3,246 | 2,925 | 3,217 | 2,798 | 3,301 | 3,212 | 3,974 | 3,517 |
| 1990 | 2,993 | 3,210 | 3,243 | 2,785 | 2,935 | 3,105 | 3,403 | 3,677 | 3,043 | 2,376 | 2,303 | 2,169 |
| 1991 | 2,466 | 1,680 | 1,844 | 2,204 | 3,528 | 2,897 | 3,487 | 3,140 | 3,712 | 3,181 | 2,619 | 3,321 |
| 1992 | 2,364 | 1,807 | 2,053 | 2,562 | 2,198 | 2,847 | 2,709 | 3,180 | 3,063 | 2,236 | 2,956 | 2,523 |
| 1993 | 2,523 | 2,852 | 3,000 | 2,204 | 2,796 | 2,682 | 3,663 | 2,768 | 2,441 | 1,906 | 3,588 | 3,706 |
| 1994 | 2,576 | 2,631 | 2,221 | 2,725 | 3,014 | 2,974 | 2,698 | 2,818 | 3,673 | 3,667 | 3,796 | 4,313 |
| 1995 | 3,912 | 3,204 | 3,227 | 4,049 | 3,025 | 3,851 | 3,832 | 3,580 | 3,443 | 3,414 | 4,287 | 4,010 |
| 1996 | 3,407 | 3,924 | 3,524 | 4,172 | 3,573 | 3,703 | 4,670 | 4,221 | 4,236 | 4,424 | 3,896 | 3,895 |
| 1997 | 3,606 | 2,964 | 4,389 | 3,425 | 3,782 | 3,779 | 5,067 | 5,079 | 3,727 | 3,995 | 3,825 | 5,170 |
| 1998 | 3,834 | 2,854 | 4,841 | 4,418 | 3,575 | 4,720 | 4,798 | 4,973 | 4,456 | 5,064 | 4,835 | 4,447 |
| 1999 | 3,521 | 4,383 | 4,169 | 3,901 | 5,671 | 4,894 | 4,910 | 4,910 | 4,984 | 5,547 | 5,287 | 6,651 |
| 2000 | 4,874 | 4,686 | 3,603 | 5,383 | 4,594 | 4,815 | 4,883 | 5,338 | 4,606 | 5,037 | 4,854 | 4,861 |
| 2001 | 4,877 | 4,326 | 4,518 | 4,043 | 4,680 | 3,758 | 5,291 | 4,349 | 4,180 | 3,626 | 5,062 | 4,296 |
| 2002 | 4,813 | 3,092 | 3,480 | 3,376 | 3,772 | 3,501 | 4,051 | 4,089 | 3,892 | 3,382 | 2,379 | 4,773 |
| 2003 | 4,417 | 2,835 | 3,339 | 3,112 | 3,280 | 3,276 | 4,028 | 4,216 | 3,799 | 3,313 | 4,910 | 4,476 |
| 2004 | 3,763 | 3,877 | 3,482 | 3,639 | 3,469 | 3,659 | 4,429 | 4,428 | 4,233 | 4,275 | 3,436 | 3,751 |
| 2005 | 3,646 | 3,685 | 3,593 | 4,033 | 3,738 | 3,660 | 3,573 | 4,012 | 3,131 | 3,523 | 4,535 | 3,846 |
| 2006 | 2,651 | 3,453 | 3,490 | 2,726 | 3,558 | 3,183 | 4,196 | 3,961 | 4,472 | 3,006 | 3,656 | 3,538 |
| 2007 | 2,934 | 3,374 | 3,309 | 3,367 | 3,802 | 3,512 | 3,788 | 3,719 | 3,805 | 3,479 | 3,704 | 3,573 |
| 2008 | 3,585 | 2,474 | 2,954 | 3,442 | 2,837 | 2,242 | 2,582 | 3,583 | 1,481 | 2,545 | 1,919 | 1,884 |
| 2009 | 2,392 | 1,676 | 1,545 | 1,264 | 1,544 | 1,576 | 1,627 | 1,988 | 1,920 | 1,574 | 1,720 | 1,472 |
| 2010 | 1,517 | 1,396 | 1,169 | 2,352 | 1,607 | 2,015 | 1,631 | 1,508 | 1,929 | 2,435 | 2,104 | 2,016 |
| 2011 | 1,483 | 1,140 | 1,695 | 1,919 | 1,373 | 1,354 | 1,770 | 2,622 | 2,176 | 2,115 | 1,763 | 1,441 |
| 2012 | 1,067 | 870 | 1,098 | 854 | 972 | 1,255 | 1,259 | 2,190 | 1,776 | 1,240 | 1,476 | 1,241 |
| 2013 | 841 | 1,260 | 1,526 | 1,315 | 873 | 1,703 | 1,408 | 1,467 | 1,278 | 1,409 | 1,291 | 1,561 |
| 2014 | 1,046 | 1,237 | 1,507 | 1,710 | 1,464 | 1,462 | 1,846 | 1,589 | 2,177 | 1,405 | 1,712 | 1,644 |
| 2015 | 1,403 | 1,020 | 1,417 | 1,199 | 1,218 | 1,185 | 1,385 | 2,135 | 2,208 | 1,529 | 1,654 | 1,303 |
| 2016 | 1,684 | 982 | 1,148 | 1,167 | 1,027 | 1,849 | 1,722 | 1,655 | 1,980 | 1,100 | 1,081 | 1,481 |
| 2017 | 1,397 | 1,258 | 1,058 | 1,339 | 1,615 | 1,627 | 1,382 | 1,681 | 1,644 | 1,581 | 1,281 | 1,824 |
| 2018 | 1,587 | 2,036 | 1,496 | 1,209 | 1,466 | 1,857 | 1,863 | 1,954 | 2,012 | 2,110 | 1,746 | 1,626 |
| 2019 | 1,243 | 1,644 | 1,803 | 1,586 | 1,254 | 1,169 | 1,540 | 1,414 | 1,430 | 1,256 | 2,205 | 1,494 |
| 2020 | 1,132 | 1,504 | 1,008 | 772 | 747 | 728 | 1,633 | 1,126 | 857 | 969 | 875 | 804 |
| 2021 | 696 | 550 | 1,209 | 1,251 | 1,151 | 1,487 | 1,426 | 1,721 | 1,390 | 1,440 | 1,122 | 1,168 |
| 2022 | 1,329 | 1,255 | 876 | 998 | 1,190 | 1,644 | 1,023 | 1,047 | 593 | 602 | 1,460 | 1,660 |
| 2023 | 1,755 | 1,837 | 866 | 1,122 | 1,098 | 1,086 | 1,097 | 1,173 | 1,248 | 1,443 | 1,894 | 1,393 |
| 2024 | 999 | |||||||||||
| - = No Data Reported; -- = Not Applicable; NA = Not Available; W = Withheld to avoid disclosure of individual company data. |
| Release Date: 3/29/2024 |
| Next Release Date: 4/30/2024 |