|
Download Data (XLS File) |
|
||||||||
|
||||||||
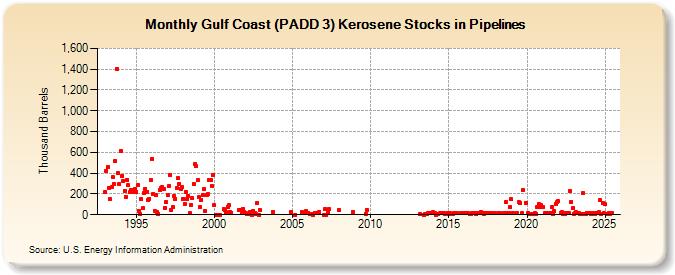
| Gulf Coast (PADD 3) Kerosene Stocks in Pipelines (Thousand Barrels) | ||||||||
| Year | Jan | Feb | Mar | Apr | May | Jun | Jul | Aug | Sep | Oct | Nov | Dec |
|---|---|---|---|---|---|---|---|---|---|---|---|---|
| 1993 | 215 | 423 | 457 | 261 | 147 | 263 | 363 | 299 | 518 | 1,403 | 399 | 292 |
| 1994 | 617 | 376 | 324 | 230 | 174 | 334 | 283 | 216 | 242 | 220 | 241 | 252 |
| 1995 | 222 | 282 | 38 | 8 | 147 | 62 | 213 | 251 | 223 | 142 | 154 | 333 |
| 1996 | 538 | 201 | 40 | 190 | 24 | 10 | 240 | 259 | 263 | 251 | 68 | 120 |
| 1997 | 187 | 273 | 386 | 46 | 71 | 176 | 154 | 257 | 351 | 297 | 248 | 264 |
| 1998 | 155 | 105 | 219 | 153 | 184 | 16 | 98 | 157 | 298 | 486 | 465 | 332 |
| 1999 | 170 | 74 | 142 | 194 | 247 | 40 | 192 | 198 | 333 | 338 | 276 | 383 |
| 2000 | 91 | 0 | 0 | 0 | 0 | 56 | 42 | 22 | 77 | 89 | ||
| 2001 | 28 | 19 | 49 | 46 | 28 | 59 | 30 | |||||
| 2002 | 15 | 6 | 9 | 24 | 1 | 39 | 19 | 8 | 116 | 2 | 43 | |
| 2003 | 30 | |||||||||||
| 2004 | 25 | |||||||||||
| 2005 | 1 | 25 | 19 | 20 | 32 | |||||||
| 2006 | 20 | 11 | 8 | 2 | 20 | 20 | 25 | |||||
| 2007 | 2 | 57 | 2 | 24 | 52 | |||||||
| 2008 | 41 | 25 | ||||||||||
| 2009 | 5 | 48 | ||||||||||
| 2013 | 5 | 2 | 3 | 10 | 12 | 14 | 12 | |||||
| 2014 | 22 | 21 | 1 | 10 | 12 | 12 | 12 | 8 | 4 | 18 | ||
| 2015 | 9 | 14 | 6 | 6 | 12 | 18 | 14 | 17 | 16 | 12 | ||
| 2016 | 16 | 13 | 5 | 7 | 14 | 19 | 20 | 7 | 12 | 13 | ||
| 2017 | 24 | 13 | 7 | 14 | 14 | 14 | 15 | 18 | ||||
| 2018 | 16 | 18 | 15 | 123 | 18 | 20 | 75 | |||||
| 2019 | 147 | 21 | 20 | 121 | 116 | 14 | 233 | 116 | ||||
| 2020 | 12 | 7 | 9 | 10 | 9 | 12 | 10 | 77 | 100 | 75 | 90 | |
| 2021 | 75 | 14 | 19 | 21 | 76 | 5 | 35 | 105 | 121 | |||
| 2022 | 128 | 21 | 23 | 8 | 11 | 21 | 14 | 12 | 228 | 127 | 61 | |
| 2023 | 9 | 17 | 22 | 12 | 13 | 6 | 11 | 206 | 9 | 11 | 17 | 19 |
| 2024 | 12 | |||||||||||
| - = No Data Reported; -- = Not Applicable; NA = Not Available; W = Withheld to avoid disclosure of individual company data. |
| Release Date: 3/29/2024 |
| Next Release Date: 4/30/2024 |