|
Download Data (XLS File) |
|
||||||||
|
||||||||
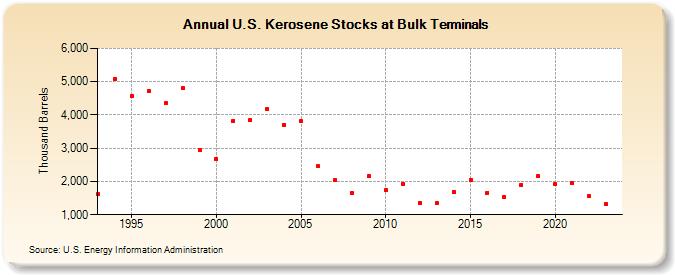
| U.S. Kerosene Stocks at Bulk Terminals (Thousand Barrels) | ||||||||
| Decade | Year-0 | Year-1 | Year-2 | Year-3 | Year-4 | Year-5 | Year-6 | Year-7 | Year-8 | Year-9 |
|---|---|---|---|---|---|---|---|---|---|---|
| 1990's | 1,630 | 5,079 | 4,582 | 4,723 | 4,348 | 4,802 | 2,954 | |||
| 2000's | 2,688 | 3,822 | 3,842 | 4,172 | 3,708 | 3,805 | 2,453 | 2,045 | 1,643 | 2,157 |
| 2010's | 1,733 | 1,936 | 1,358 | 1,345 | 1,692 | 2,033 | 1,664 | 1,529 | 1,892 | 2,156 |
| 2020's | 1,917 | 1,942 | 1,553 | 1,319 |
| - = No Data Reported; -- = Not Applicable; NA = Not Available; W = Withheld to avoid disclosure of individual company data. |
| Release Date: 3/29/2024 |
| Next Release Date: 8/30/2024 |