|
Download Data (XLS File) |
|
||||||||
|
||||||||
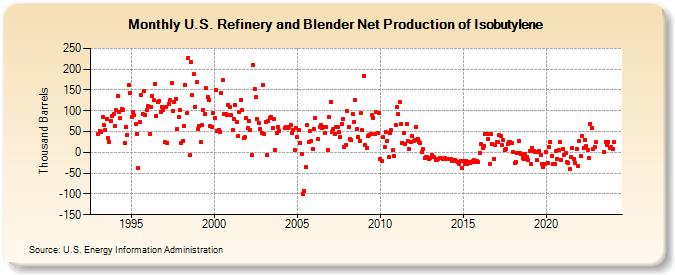
| U.S. Refinery and Blender Net Production of Isobutylene (Thousand Barrels) | ||||||||
| Year | Jan | Feb | Mar | Apr | May | Jun | Jul | Aug | Sep | Oct | Nov | Dec |
|---|---|---|---|---|---|---|---|---|---|---|---|---|
| 1993 | 45 | 51 | 48 | 86 | 65 | 54 | 80 | 35 | 26 | 76 | 87 | 92 |
| 1994 | 64 | 101 | 135 | 96 | 83 | 105 | 103 | 22 | 62 | 42 | 162 | 143 |
| 1995 | 85 | 98 | 89 | 68 | 43 | -38 | 74 | 138 | 92 | 148 | 90 | 101 |
| 1996 | 112 | 43 | 110 | 135 | 125 | 165 | 87 | 121 | 124 | 98 | 108 | 103 |
| 1997 | 24 | 110 | 23 | 117 | 125 | 166 | 100 | 122 | 129 | 57 | 85 | 102 |
| 1998 | 23 | 28 | 64 | 162 | 94 | 228 | -7 | 217 | 137 | 188 | 110 | 168 |
| 1999 | 55 | 64 | 24 | 65 | 103 | 93 | 154 | 133 | 126 | 63 | 61 | 94 |
| 2000 | 83 | 149 | 51 | 54 | 50 | 142 | 173 | 93 | 92 | 89 | 115 | 108 |
| 2001 | 89 | 54 | 79 | 115 | 72 | 39 | 96 | 125 | 102 | 34 | 36 | 83 |
| 2002 | 58 | 75 | 54 | -7 | 211 | 153 | 133 | 80 | 70 | 55 | 47 | 161 |
| 2003 | 44 | 74 | -6 | 75 | 82 | 84 | 58 | 79 | 6 | 47 | 60 | 52 |
| 2004 | 58 | 61 | 58 | 61 | 65 | 47 | 54 | 6 | 58 | |||
| 2005 | 36 | 53 | 22 | -5 | -100 | -93 | -36 | 65 | 24 | 52 | 27 | 7 |
| 2006 | 56 | 82 | 31 | 61 | 65 | 59 | 60 | 47 | 61 | 6 | 86 | |
| 2007 | 122 | 49 | 55 | 45 | 60 | 62 | 48 | 37 | 67 | 80 | 13 | 17 |
| 2008 | 100 | 62 | 31 | 30 | 93 | 74 | 125 | 57 | 38 | 28 | 94 | 53 |
| 2009 | 184 | 18 | 11 | 39 | 42 | 44 | 90 | 83 | 44 | 97 | 47 | 95 |
| 2010 | -15 | -22 | 36 | 13 | 48 | 28 | -12 | 46 | 53 | 6 | -9 | 65 |
| 2011 | 110 | 92 | 120 | 69 | 22 | 47 | 19 | 68 | 28 | 9 | 25 | 40 |
| 2012 | 27 | 30 | 61 | 33 | 24 | 22 | 1 | 7 | -14 | -11 | -11 | -15 |
| 2013 | -14 | -6 | -11 | -12 | -19 | -19 | -17 | -14 | -14 | -15 | -15 | -14 |
| 2014 | -17 | -15 | -16 | -17 | -20 | -18 | -19 | -22 | -23 | -29 | -20 | -37 |
| 2015 | -21 | -29 | -21 | -27 | -23 | -26 | -24 | -21 | -19 | -24 | -22 | -24 |
| 2016 | -2 | 20 | 11 | 16 | 43 | 44 | 31 | -27 | 43 | 21 | -16 | 18 |
| 2017 | 24 | 26 | 41 | 40 | 18 | 29 | 6 | 9 | 20 | 24 | 26 | 23 |
| 2018 | 1 | -26 | -23 | -2 | 28 | -1 | -3 | -13 | -15 | -5 | -10 | -18 |
| 2019 | 3 | -28 | 11 | 3 | 0 | -18 | 1 | 4 | -6 | -27 | -36 | -27 |
| 2020 | 2 | -25 | 14 | 25 | -9 | -28 | -28 | 3 | -17 | 6 | 25 | -18 |
| 2021 | 8 | -6 | -1 | -24 | -26 | -41 | -12 | 11 | -16 | -26 | 9 | -33 |
| 2022 | 27 | -9 | 39 | 10 | 29 | 15 | 6 | -14 | 69 | 59 | 9 | 13 |
| 2023 | 24 | 1 | 25 | 17 | 25 | 10 | 13 | |||||
| 2024 | 9 | |||||||||||
| - = No Data Reported; -- = Not Applicable; NA = Not Available; W = Withheld to avoid disclosure of individual company data. |
| Release Date: 3/29/2024 |
| Next Release Date: 4/30/2024 |