|
Download Data (XLS File) |
|
||||||||
|
||||||||
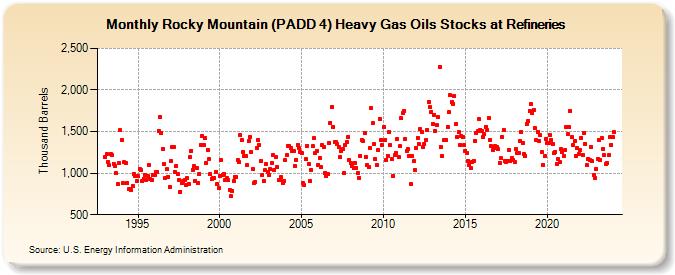
| Rocky Mountain (PADD 4) Heavy Gas Oils Stocks at Refineries (Thousand Barrels) | ||||||||
| Year | Jan | Feb | Mar | Apr | May | Jun | Jul | Aug | Sep | Oct | Nov | Dec |
|---|---|---|---|---|---|---|---|---|---|---|---|---|
| 1993 | 1,191 | 1,226 | 1,139 | 1,092 | 1,230 | 1,217 | 1,113 | 1,083 | 996 | 867 | 1,120 | 1,514 |
| 1994 | 1,399 | 876 | 1,130 | 1,124 | 884 | 804 | 814 | 796 | 847 | 993 | 970 | 901 |
| 1995 | 962 | 1,051 | 1,037 | 904 | 934 | 977 | 923 | 970 | 1,093 | 926 | 920 | 982 |
| 1996 | 979 | 1,011 | 1,015 | 1,511 | 1,677 | 1,488 | 1,295 | 1,108 | 945 | 1,045 | 959 | 834 |
| 1997 | 1,141 | 1,319 | 1,320 | 1,018 | 1,090 | 986 | 916 | 779 | 883 | 901 | 921 | 863 |
| 1998 | 936 | 874 | 1,189 | 1,270 | 1,041 | 1,082 | 909 | 1,067 | 881 | 992 | 1,342 | 1,452 |
| 1999 | 1,338 | 1,418 | 1,122 | 1,280 | 1,164 | 989 | 933 | 941 | 946 | 1,016 | 869 | 819 |
| 2000 | 969 | 1,155 | 979 | 992 | 918 | 943 | 923 | 802 | 721 | 790 | 907 | 948 |
| 2001 | 954 | 1,156 | 1,131 | 1,456 | 1,399 | 1,255 | 1,205 | 1,206 | 1,095 | 1,387 | 1,435 | 1,253 |
| 2002 | 1,047 | 877 | 898 | 1,304 | 1,399 | 1,337 | 1,147 | 981 | 906 | 1,033 | 1,111 | 1,016 |
| 2003 | 973 | 1,046 | 1,117 | 1,215 | 1,037 | 1,191 | 1,074 | 914 | 922 | 948 | 886 | 907 |
| 2004 | 1,153 | 1,219 | 1,332 | 1,326 | 1,302 | 1,262 | 1,269 | 1,085 | 1,158 | 1,342 | 1,308 | 1,256 |
| 2005 | 1,237 | 880 | 852 | 1,164 | 1,332 | 1,113 | 906 | 1,038 | 1,321 | 1,418 | 1,246 | 1,264 |
| 2006 | 1,101 | 1,183 | 1,070 | 1,335 | 1,320 | 1,003 | 962 | 989 | 1,365 | 1,607 | 1,798 | 1,560 |
| 2007 | 1,374 | 1,376 | 1,347 | 1,310 | 1,196 | 1,267 | 1,286 | 997 | 1,344 | 1,374 | 1,439 | 1,160 |
| 2008 | 1,117 | 1,080 | 1,061 | 1,126 | 1,067 | 999 | 944 | 1,210 | 1,398 | 1,387 | 1,482 | 1,191 |
| 2009 | 1,095 | 1,078 | 1,304 | 1,782 | 1,598 | 1,349 | 1,165 | 1,103 | 1,276 | 1,651 | 1,396 | 1,337 |
| 2010 | 1,552 | 1,401 | 1,161 | 1,212 | 1,496 | 1,338 | 1,169 | 963 | 1,218 | 1,244 | 1,415 | 1,196 |
| 2011 | 1,325 | 1,658 | 1,723 | 1,751 | 1,415 | 1,268 | 1,287 | 1,206 | 864 | 1,204 | 1,142 | 1,040 |
| 2012 | 1,306 | 1,427 | 1,348 | 1,527 | 1,493 | 1,320 | 1,354 | 1,398 | 1,524 | 1,855 | 1,790 | 1,740 |
| 2013 | 1,593 | 1,705 | 1,512 | 1,575 | 1,673 | 2,282 | 1,318 | 1,206 | 1,393 | 1,404 | 1,400 | 1,556 |
| 2014 | 1,731 | 1,936 | 1,856 | 1,834 | 1,930 | 1,592 | 1,440 | 1,492 | 1,336 | 1,448 | 1,439 | 1,340 |
| 2015 | 1,272 | 1,240 | 1,151 | 1,099 | 1,056 | 1,137 | 1,151 | 1,390 | 1,488 | 1,502 | 1,649 | 1,524 |
| 2016 | 1,501 | 1,429 | 1,466 | 1,558 | 1,521 | 1,666 | 1,402 | 1,322 | 1,280 | 1,304 | 1,324 | 1,312 |
| 2017 | 1,286 | 1,125 | 1,179 | 1,432 | 1,520 | 1,150 | 1,138 | 1,151 | 1,279 | 1,140 | 1,183 | 1,160 |
| 2018 | 1,135 | 1,290 | 1,247 | 1,244 | 1,385 | 1,492 | 1,359 | 1,230 | 1,204 | 1,593 | 1,629 | 1,751 |
| 2019 | 1,828 | 1,719 | 1,764 | 1,537 | 1,394 | 1,500 | 1,384 | 1,458 | 1,257 | 1,099 | 1,202 | 1,414 |
| 2020 | 1,363 | 1,360 | 1,461 | 1,396 | 1,352 | 1,239 | 1,257 | 1,112 | 1,164 | 1,135 | 1,285 | 1,259 |
| 2021 | 1,206 | 1,278 | 1,554 | 1,465 | 1,552 | 1,749 | 1,431 | 1,340 | 1,381 | 1,208 | 1,298 | 1,233 |
| 2022 | 1,280 | 1,427 | 1,219 | 1,488 | 1,354 | 1,093 | 1,171 | 1,158 | 1,317 | 1,142 | 979 | 943 |
| 2023 | 1,052 | 1,172 | 1,394 | 1,155 | 1,425 | 1,295 | 1,213 | 1,110 | 1,117 | 1,213 | 1,430 | 1,343 |
| 2024 | 1,433 | |||||||||||
| - = No Data Reported; -- = Not Applicable; NA = Not Available; W = Withheld to avoid disclosure of individual company data. |
| Release Date: 3/29/2024 |
| Next Release Date: 4/30/2024 |