|
Download Data (XLS File) |
|
||||||||
|
||||||||
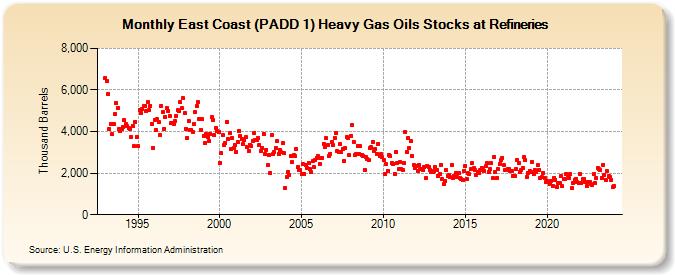
| East Coast (PADD 1) Heavy Gas Oils Stocks at Refineries (Thousand Barrels) | ||||||||
| Year | Jan | Feb | Mar | Apr | May | Jun | Jul | Aug | Sep | Oct | Nov | Dec |
|---|---|---|---|---|---|---|---|---|---|---|---|---|
| 1993 | 6,565 | 6,416 | 5,796 | 4,112 | 4,363 | 3,869 | 4,378 | 4,832 | 5,379 | 5,136 | 4,138 | 4,040 |
| 1994 | 4,102 | 4,196 | 4,539 | 4,368 | 4,246 | 4,150 | 4,115 | 3,746 | 4,286 | 3,289 | 4,472 | 3,746 |
| 1995 | 3,290 | 5,022 | 4,882 | 5,086 | 5,212 | 5,229 | 5,007 | 5,405 | 5,022 | 5,241 | 4,386 | 3,227 |
| 1996 | 4,579 | 4,096 | 4,582 | 4,448 | 3,839 | 5,232 | 4,931 | 4,128 | 4,716 | 5,113 | 4,994 | 4,746 |
| 1997 | 4,397 | 4,432 | 4,353 | 4,503 | 4,757 | 5,023 | 4,995 | 5,398 | 5,121 | 5,593 | 4,884 | 4,137 |
| 1998 | 3,707 | 4,506 | 4,089 | 4,063 | 3,992 | 4,376 | 4,927 | 5,222 | 5,403 | 4,600 | 4,096 | 4,587 |
| 1999 | 3,808 | 3,430 | 3,894 | 3,728 | 3,534 | 3,900 | 4,683 | 4,555 | 3,832 | 4,183 | 4,043 | 3,996 |
| 2000 | 2,495 | 2,952 | 3,816 | 3,352 | 3,457 | 4,471 | 3,638 | 3,929 | 3,143 | 3,692 | 3,191 | 3,373 |
| 2001 | 3,040 | 3,487 | 4,047 | 3,777 | 3,646 | 3,395 | 3,570 | 3,717 | 3,248 | 3,072 | 3,376 | 3,306 |
| 2002 | 3,554 | 3,929 | 3,599 | 3,583 | 3,692 | 3,356 | 3,051 | 3,225 | 3,885 | 2,911 | 3,133 | 2,378 |
| 2003 | 2,849 | 2,001 | 3,858 | 2,905 | 3,000 | 3,208 | 3,524 | 2,920 | 3,128 | 2,997 | 3,429 | 2,952 |
| 2004 | 1,282 | 1,804 | 2,053 | 1,892 | 2,806 | 2,517 | 2,850 | 2,801 | 3,170 | 2,292 | 2,128 | 2,156 |
| 2005 | 1,937 | 2,435 | 1,982 | 2,390 | 2,266 | 2,493 | 2,183 | 2,036 | 2,581 | 2,289 | 2,647 | 2,740 |
| 2006 | 2,808 | 2,441 | 2,704 | 2,741 | 3,420 | 3,250 | 3,667 | 3,365 | 2,813 | 2,935 | 3,487 | 3,332 |
| 2007 | 3,713 | 3,922 | 3,042 | 2,997 | 3,403 | 2,997 | 3,166 | 2,566 | 3,194 | 3,740 | 3,707 | 2,856 |
| 2008 | 3,802 | 4,319 | 3,519 | 2,850 | 2,919 | 3,313 | 2,936 | 3,284 | 2,891 | 2,845 | 2,155 | 2,752 |
| 2009 | 2,690 | 2,634 | 3,206 | 3,242 | 3,493 | 3,042 | 3,160 | 2,925 | 3,418 | 2,805 | 2,900 | 2,763 |
| 2010 | 2,649 | 1,977 | 2,417 | 2,104 | 2,868 | 2,835 | 2,485 | 2,441 | 1,976 | 3,024 | 2,488 | 2,182 |
| 2011 | 2,557 | 2,178 | 2,154 | 2,493 | 3,970 | 3,034 | 3,692 | 3,191 | 3,533 | 2,834 | 2,382 | 2,269 |
| 2012 | 2,340 | 2,090 | 2,415 | 2,181 | 2,202 | 2,145 | 2,287 | 1,757 | 2,345 | 2,274 | 2,164 | 2,074 |
| 2013 | 2,052 | 2,126 | 2,279 | 2,159 | 1,875 | 1,965 | 2,394 | 1,705 | 1,491 | 1,614 | 2,152 | 1,842 |
| 2014 | 1,895 | 1,808 | 2,395 | 1,752 | 1,868 | 2,022 | 1,825 | 1,995 | 1,770 | 1,741 | 1,692 | 2,123 |
| 2015 | 2,355 | 1,727 | 1,990 | 1,966 | 2,193 | 2,470 | 2,233 | 2,128 | 1,901 | 2,052 | 2,001 | 2,146 |
| 2016 | 2,261 | 2,159 | 2,090 | 2,320 | 2,464 | 2,065 | 2,177 | 2,481 | 1,746 | 2,778 | 2,036 | 1,767 |
| 2017 | 2,178 | 2,435 | 2,640 | 2,750 | 2,371 | 2,158 | 2,141 | 2,202 | 2,208 | 2,124 | 2,095 | 1,872 |
| 2018 | 1,863 | 2,192 | 2,655 | 2,470 | 2,062 | 2,173 | 2,237 | 2,758 | 2,629 | 1,814 | 2,029 | 2,120 |
| 2019 | 2,042 | 2,547 | 1,946 | 2,145 | 2,057 | 2,371 | 2,169 | 1,778 | 1,801 | 2,029 | 1,772 | 1,563 |
| 2020 | 1,638 | 1,570 | 1,476 | 1,637 | 1,395 | 1,789 | 1,687 | 1,340 | 1,521 | 1,540 | 1,863 | 1,359 |
| 2021 | 1,730 | 1,720 | 1,974 | 1,892 | 1,770 | 1,954 | 1,272 | 1,535 | 1,693 | 1,731 | 1,550 | 1,548 |
| 2022 | 1,977 | 1,535 | 1,699 | 1,712 | 1,593 | 1,381 | 1,554 | 1,555 | 1,497 | 1,442 | 1,945 | 1,544 |
| 2023 | 1,760 | 2,235 | 2,184 | 2,132 | 1,785 | 2,392 | 1,903 | 1,673 | 2,080 | 1,860 | 1,808 | 1,684 |
| 2024 | 1,312 | |||||||||||
| - = No Data Reported; -- = Not Applicable; NA = Not Available; W = Withheld to avoid disclosure of individual company data. |
| Release Date: 3/29/2024 |
| Next Release Date: 4/30/2024 |