|
Download Data (XLS File) |
|
||||||||
|
||||||||
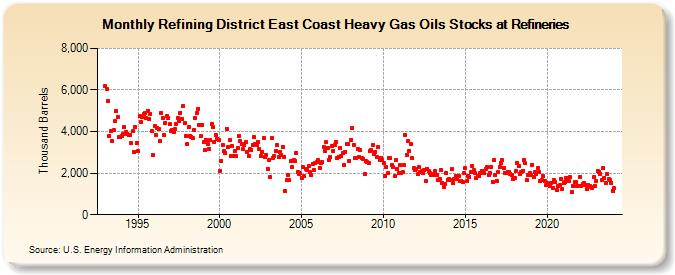
| Refining District East Coast Heavy Gas Oils Stocks at Refineries (Thousand Barrels) | ||||||||
| Year | Jan | Feb | Mar | Apr | May | Jun | Jul | Aug | Sep | Oct | Nov | Dec |
|---|---|---|---|---|---|---|---|---|---|---|---|---|
| 1993 | 6,169 | 6,042 | 5,450 | 3,802 | 4,012 | 3,552 | 4,056 | 4,507 | 5,000 | 4,686 | 3,758 | 3,731 |
| 1994 | 3,808 | 3,888 | 4,220 | 3,992 | 3,897 | 3,832 | 3,824 | 3,447 | 4,009 | 3,037 | 4,218 | 3,463 |
| 1995 | 3,041 | 4,732 | 4,452 | 4,693 | 4,844 | 4,872 | 4,643 | 5,011 | 4,595 | 4,850 | 4,028 | 2,891 |
| 1996 | 4,274 | 3,835 | 4,159 | 4,134 | 3,528 | 4,903 | 4,659 | 3,814 | 4,402 | 4,753 | 4,629 | 4,342 |
| 1997 | 4,015 | 4,063 | 3,965 | 4,111 | 4,370 | 4,644 | 4,508 | 4,911 | 4,621 | 5,232 | 4,420 | 3,805 |
| 1998 | 3,383 | 4,204 | 3,795 | 3,753 | 3,668 | 4,087 | 4,664 | 4,909 | 5,100 | 4,316 | 3,773 | 4,318 |
| 1999 | 3,490 | 3,109 | 3,598 | 3,407 | 3,165 | 3,584 | 4,365 | 4,203 | 3,505 | 3,835 | 3,660 | 3,573 |
| 2000 | 2,104 | 2,595 | 3,355 | 3,047 | 2,978 | 4,144 | 3,272 | 3,592 | 2,830 | 3,301 | 2,835 | 3,051 |
| 2001 | 2,809 | 3,226 | 3,788 | 3,539 | 3,391 | 3,143 | 3,369 | 3,499 | 3,027 | 2,822 | 3,158 | 3,096 |
| 2002 | 3,369 | 3,719 | 3,380 | 3,364 | 3,501 | 3,163 | 2,837 | 3,016 | 3,690 | 2,752 | 2,890 | 2,215 |
| 2003 | 2,650 | 1,810 | 3,696 | 2,747 | 2,832 | 3,054 | 3,345 | 2,755 | 3,013 | 2,851 | 3,276 | 2,781 |
| 2004 | 1,122 | 1,669 | 1,932 | 1,661 | 2,562 | 2,280 | 2,630 | 2,595 | 2,987 | 2,072 | 1,940 | 1,984 |
| 2005 | 1,782 | 2,281 | 1,848 | 2,208 | 2,164 | 2,347 | 2,050 | 1,900 | 2,449 | 2,167 | 2,485 | 2,548 |
| 2006 | 2,620 | 2,262 | 2,468 | 2,540 | 3,238 | 3,063 | 3,480 | 3,200 | 2,641 | 2,767 | 3,296 | 3,053 |
| 2007 | 3,372 | 3,510 | 2,713 | 2,798 | 3,217 | 2,826 | 2,980 | 2,390 | 3,031 | 3,412 | 3,394 | 2,598 |
| 2008 | 3,597 | 4,165 | 3,375 | 2,708 | 2,746 | 3,166 | 2,767 | 3,124 | 2,737 | 2,664 | 1,963 | 2,573 |
| 2009 | 2,541 | 2,484 | 3,056 | 3,100 | 3,353 | 2,903 | 3,032 | 2,779 | 3,265 | 2,649 | 2,737 | 2,617 |
| 2010 | 2,501 | 1,851 | 2,286 | 1,990 | 2,734 | 2,715 | 2,368 | 2,291 | 1,845 | 2,628 | 2,218 | 1,993 |
| 2011 | 2,380 | 2,026 | 2,031 | 2,372 | 3,835 | 2,887 | 3,540 | 3,069 | 3,398 | 2,711 | 2,231 | 2,136 |
| 2012 | 2,202 | 1,945 | 2,290 | 2,053 | 2,079 | 2,024 | 2,148 | 1,623 | 2,216 | 2,126 | 2,001 | 1,909 |
| 2013 | 1,896 | 1,975 | 2,115 | 1,926 | 1,657 | 1,723 | 2,166 | 1,542 | 1,351 | 1,473 | 2,022 | 1,691 |
| 2014 | 1,714 | 1,656 | 2,183 | 1,503 | 1,710 | 1,881 | 1,700 | 1,862 | 1,641 | 1,612 | 1,568 | 1,992 |
| 2015 | 2,231 | 1,609 | 1,875 | 1,804 | 2,042 | 2,357 | 2,129 | 1,997 | 1,749 | 1,886 | 1,848 | 1,997 |
| 2016 | 2,120 | 2,042 | 1,983 | 2,195 | 2,302 | 1,901 | 2,027 | 2,311 | 1,586 | 2,622 | 1,904 | 1,636 |
| 2017 | 2,056 | 2,286 | 2,509 | 2,611 | 2,239 | 2,026 | 2,017 | 2,071 | 2,062 | 1,947 | 1,920 | 1,703 |
| 2018 | 1,745 | 2,083 | 2,505 | 2,343 | 1,947 | 2,060 | 2,120 | 2,612 | 2,467 | 1,658 | 1,894 | 1,990 |
| 2019 | 1,925 | 2,412 | 1,829 | 2,042 | 1,946 | 2,249 | 2,036 | 1,635 | 1,651 | 1,873 | 1,631 | 1,409 |
| 2020 | 1,518 | 1,466 | 1,366 | 1,534 | 1,289 | 1,666 | 1,559 | 1,199 | 1,398 | 1,414 | 1,729 | 1,236 |
| 2021 | 1,536 | 1,561 | 1,785 | 1,732 | 1,602 | 1,796 | 1,112 | 1,398 | 1,556 | 1,579 | 1,404 | 1,388 |
| 2022 | 1,814 | 1,383 | 1,490 | 1,531 | 1,441 | 1,257 | 1,416 | 1,401 | 1,342 | 1,298 | 1,791 | 1,400 |
| 2023 | 1,618 | 2,094 | 2,047 | 1,977 | 1,650 | 2,251 | 1,767 | 1,546 | 1,948 | 1,708 | 1,649 | 1,546 |
| 2024 | 1,153 | |||||||||||
| - = No Data Reported; -- = Not Applicable; NA = Not Available; W = Withheld to avoid disclosure of individual company data. |
| Release Date: 3/29/2024 |
| Next Release Date: 4/30/2024 |
Referring Pages: