|
Download Data (XLS File) |
|
||||||||
|
||||||||
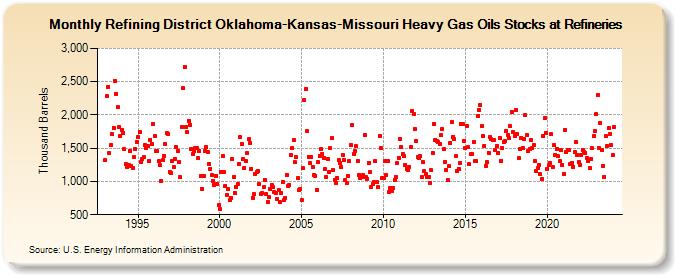
| Refining District Oklahoma-Kansas-Missouri Heavy Gas Oils Stocks at Refineries (Thousand Barrels) | ||||||||
| Year | Jan | Feb | Mar | Apr | May | Jun | Jul | Aug | Sep | Oct | Nov | Dec |
|---|---|---|---|---|---|---|---|---|---|---|---|---|
| 1993 | 1,319 | 2,283 | 2,427 | 1,427 | 1,545 | 1,706 | 1,809 | 2,516 | 2,319 | 2,113 | 1,818 | 1,690 |
| 1994 | 1,778 | 1,729 | 1,483 | 1,256 | 1,215 | 1,254 | 1,461 | 1,234 | 1,206 | 1,363 | 1,491 | 1,594 |
| 1995 | 1,665 | 1,745 | 1,294 | 1,332 | 1,360 | 1,547 | 1,510 | 1,538 | 1,314 | 1,629 | 1,569 | 1,866 |
| 1996 | 1,681 | 1,455 | 1,456 | 1,304 | 1,242 | 1,007 | 1,319 | 1,390 | 1,564 | 1,723 | 1,710 | 1,148 |
| 1997 | 1,120 | 1,312 | 1,210 | 1,334 | 1,514 | 1,456 | 1,290 | 1,063 | 1,820 | 2,399 | 2,726 | 1,817 |
| 1998 | 1,736 | 1,910 | 1,852 | 1,484 | 1,412 | 1,461 | 1,507 | 1,503 | 1,352 | 1,458 | 1,082 | 893 |
| 1999 | 1,080 | 1,459 | 1,522 | 1,438 | 1,266 | 1,188 | 1,094 | 1,008 | 942 | 1,086 | 957 | 648 |
| 2000 | 579 | 1,143 | 1,382 | 1,135 | 930 | 801 | 885 | 717 | 752 | 1,337 | 1,071 | 831 |
| 2001 | 919 | 965 | 1,268 | 1,661 | 1,570 | 1,334 | 1,206 | 1,306 | 1,422 | 1,634 | 1,577 | 1,191 |
| 2002 | 755 | 806 | 1,108 | 1,147 | 1,154 | 964 | 814 | 831 | 910 | 1,023 | 804 | 693 |
| 2003 | 761 | 881 | 947 | 917 | 848 | 822 | 741 | 871 | 684 | 831 | 992 | 728 |
| 2004 | 757 | 1,102 | 926 | 948 | 1,398 | 1,506 | 1,618 | 1,288 | 1,362 | 1,046 | 865 | 882 |
| 2005 | 724 | 1,197 | 2,220 | 2,397 | 1,751 | 1,373 | 1,271 | 1,369 | 1,221 | 1,100 | 1,086 | 877 |
| 2006 | 1,288 | 1,387 | 1,481 | 1,417 | 1,356 | 1,185 | 1,068 | 1,342 | 1,146 | 1,496 | 1,652 | 1,168 |
| 2007 | 1,022 | 982 | 1,059 | 1,328 | 1,281 | 1,219 | 1,400 | 1,320 | 1,021 | 982 | 1,084 | 1,304 |
| 2008 | 1,551 | 1,850 | 1,412 | 1,461 | 1,529 | 1,305 | 1,095 | 1,052 | 1,067 | 1,090 | 1,696 | 1,060 |
| 2009 | 1,040 | 1,282 | 1,136 | 914 | 965 | 998 | 1,305 | 989 | 916 | 1,687 | 1,506 | 1,058 |
| 2010 | 1,055 | 1,305 | 1,096 | 1,306 | 841 | 895 | 858 | 900 | 1,026 | 1,065 | 1,275 | 1,358 |
| 2011 | 1,636 | 1,514 | 1,409 | 1,376 | 1,248 | 1,191 | 1,179 | 1,220 | 1,521 | 2,055 | 2,020 | 1,789 |
| 2012 | 1,605 | 1,371 | 1,352 | 1,377 | 1,065 | 1,291 | 1,151 | 1,107 | 1,074 | 1,074 | 984 | 1,168 |
| 2013 | 1,431 | 1,871 | 1,628 | 1,610 | 1,598 | 1,570 | 1,695 | 1,783 | 1,485 | 1,294 | 1,171 | 1,015 |
| 2014 | 1,228 | 1,576 | 1,890 | 1,673 | 1,640 | 1,376 | 1,154 | 1,191 | 1,274 | 1,862 | 1,859 | 1,605 |
| 2015 | 1,504 | 1,836 | 1,513 | 1,256 | 1,406 | 1,409 | 1,594 | 1,307 | 1,309 | 1,990 | 2,076 | 2,153 |
| 2016 | 1,837 | 1,677 | 1,538 | 1,236 | 1,288 | 1,434 | 1,668 | 1,632 | 1,623 | 1,623 | 1,474 | 1,537 |
| 2017 | 1,434 | 1,650 | 1,309 | 1,504 | 1,595 | 1,604 | 1,765 | 1,705 | 1,650 | 1,829 | 2,050 | 1,742 |
| 2018 | 1,687 | 2,078 | 1,712 | 1,347 | 1,491 | 1,655 | 1,509 | 1,642 | 1,998 | 1,702 | 1,454 | 1,483 |
| 2019 | 1,628 | 1,508 | 1,548 | 1,303 | 1,156 | 1,195 | 1,252 | 1,108 | 1,036 | 1,682 | 1,953 | 1,734 |
| 2020 | 1,192 | 1,240 | 1,280 | 1,706 | 1,216 | 1,550 | 1,401 | 1,493 | 1,377 | 1,301 | 1,467 | 1,250 |
| 2021 | 1,119 | 1,780 | 1,444 | 1,479 | 1,470 | 1,266 | 1,282 | 1,219 | 1,441 | 1,589 | 1,405 | 1,296 |
| 2022 | 1,254 | 1,399 | 1,468 | 1,444 | 1,431 | 1,352 | 1,303 | 1,204 | 1,340 | 1,502 | 1,682 | 1,756 |
| 2023 | 2,011 | 2,302 | 1,502 | 1,880 | 1,471 | 1,233 | 1,074 | 1,681 | 1,530 | 1,797 | 1,717 | 1,551 |
| 2024 | 1,395 | 1,815 | ||||||||||
| - = No Data Reported; -- = Not Applicable; NA = Not Available; W = Withheld to avoid disclosure of individual company data. |
| Release Date: 4/30/2024 |
| Next Release Date: 5/31/2024 |