|
Download Data (XLS File) |
|
||||||||
|
||||||||
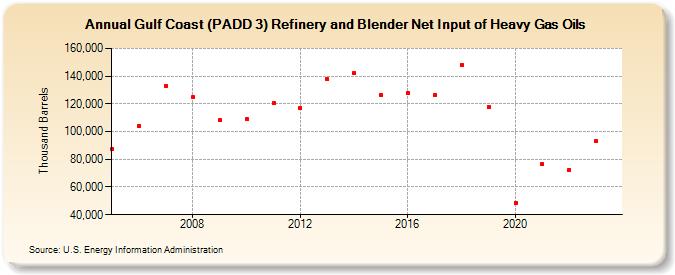
| Gulf Coast (PADD 3) Refinery and Blender Net Input of Heavy Gas Oils (Thousand Barrels) | ||||||||
| Decade | Year-0 | Year-1 | Year-2 | Year-3 | Year-4 | Year-5 | Year-6 | Year-7 | Year-8 | Year-9 |
|---|---|---|---|---|---|---|---|---|---|---|
| 2000's | 87,307 | 104,178 | 133,114 | 124,813 | 108,066 | |||||
| 2010's | 108,775 | 120,360 | 116,851 | 137,719 | 142,334 | 126,668 | 127,861 | 126,413 | 148,204 | 117,759 |
| 2020's | 48,327 | 76,528 | 72,419 | 92,985 |
| - = No Data Reported; -- = Not Applicable; NA = Not Available; W = Withheld to avoid disclosure of individual company data. |
| Release Date: 8/30/2024 |
| Next Release Date: 8/29/2025 |