|
Download Data (XLS File) |
|
||||||||
|
||||||||
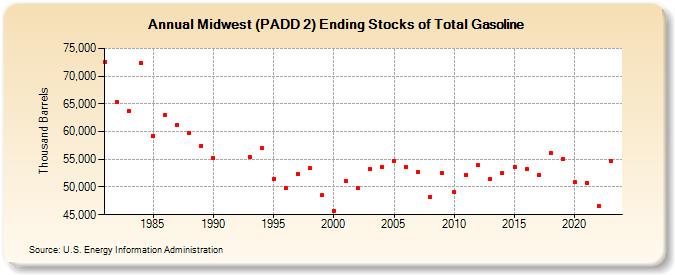
| Midwest (PADD 2) Ending Stocks of Total Gasoline (Thousand Barrels) | ||||||||
| Decade | Year-0 | Year-1 | Year-2 | Year-3 | Year-4 | Year-5 | Year-6 | Year-7 | Year-8 | Year-9 |
|---|---|---|---|---|---|---|---|---|---|---|
| 1980's | 72,601 | 65,292 | 63,703 | 72,390 | 59,214 | 63,065 | 61,184 | 59,817 | 57,440 | |
| 1990's | 55,301 | 55,432 | 56,979 | 51,409 | 49,783 | 52,377 | 53,457 | 48,480 | ||
| 2000's | 45,735 | 51,059 | 49,745 | 53,315 | 53,606 | 54,755 | 53,689 | 52,719 | 48,178 | 52,513 |
| 2010's | 49,104 | 52,215 | 53,905 | 51,527 | 52,440 | 53,674 | 53,229 | 52,209 | 56,136 | 55,016 |
| 2020's | 50,862 | 50,741 | 46,612 | 54,601 |
| - = No Data Reported; -- = Not Applicable; NA = Not Available; W = Withheld to avoid disclosure of individual company data. |
| Release Date: 3/29/2024 |
| Next Release Date: 8/30/2024 |