|
Download Data (XLS File) |
|
||||||||
|
||||||||
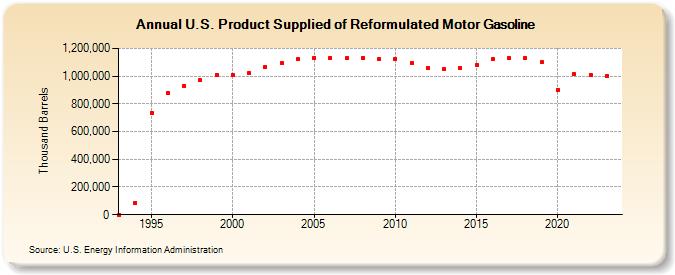
| U.S. Product Supplied of Reformulated Motor Gasoline (Thousand Barrels) | ||||||||
| Decade | Year-0 | Year-1 | Year-2 | Year-3 | Year-4 | Year-5 | Year-6 | Year-7 | Year-8 | Year-9 |
|---|---|---|---|---|---|---|---|---|---|---|
| 1990's | 0 | 86,485 | 735,319 | 874,631 | 931,662 | 969,295 | 1,008,099 | |||
| 2000's | 1,010,860 | 1,022,181 | 1,067,870 | 1,093,245 | 1,123,142 | 1,133,003 | 1,132,518 | 1,128,727 | 1,132,975 | 1,124,336 |
| 2010's | 1,122,682 | 1,093,223 | 1,059,107 | 1,049,481 | 1,061,989 | 1,080,157 | 1,122,074 | 1,127,769 | 1,132,190 | 1,099,938 |
| 2020's | 902,855 | 1,014,288 | 1,007,776 | 1,000,199 |
| - = No Data Reported; -- = Not Applicable; NA = Not Available; W = Withheld to avoid disclosure of individual company data. |
| Release Date: 3/29/2024 |
| Next Release Date: 8/30/2024 |