|
Download Data (XLS File) |
|
||||||||
|
||||||||
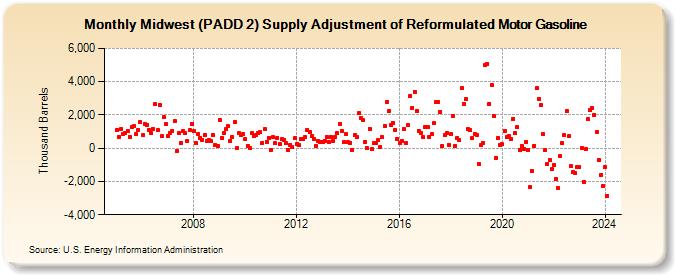
| Midwest (PADD 2) Supply Adjustment of Reformulated Motor Gasoline (Thousand Barrels) | ||||||||
| Year | Jan | Feb | Mar | Apr | May | Jun | Jul | Aug | Sep | Oct | Nov | Dec |
|---|---|---|---|---|---|---|---|---|---|---|---|---|
| 2005 | 1,114 | 684 | 1,165 | 867 | 933 | 1,031 | 682 | 1,281 | 1,338 | 836 | 1,099 | 1,561 |
| 2006 | 763 | 1,479 | 1,381 | 1,123 | 910 | 1,162 | 2,646 | 1,080 | 2,614 | 713 | 1,863 | 1,434 |
| 2007 | 713 | 939 | 1,040 | 1,632 | -166 | 892 | 297 | 1,017 | 890 | 433 | 1,068 | 1,452 |
| 2008 | 1,018 | 309 | 870 | 628 | 521 | 790 | 457 | 503 | 416 | 789 | 199 | 123 |
| 2009 | 1,711 | 620 | 908 | 1,128 | 1,333 | 460 | 662 | 1,590 | 0 | 889 | 773 | 882 |
| 2010 | 566 | 143 | 29 | 885 | 718 | 809 | 910 | 958 | 314 | 1,131 | 397 | 631 |
| 2011 | -84 | 657 | 295 | 642 | 240 | 537 | 493 | 283 | -131 | 200 | 42 | 593 |
| 2012 | 242 | 174 | 561 | 530 | 649 | 1,093 | 955 | 717 | 553 | 119 | 441 | 390 |
| 2013 | 370 | 449 | 676 | 359 | 695 | 460 | 694 | 894 | 1,469 | 1,058 | 370 | 824 |
| 2014 | 346 | 337 | -84 | 781 | 678 | 2,095 | 1,825 | 1,677 | 371 | 10 | 1,176 | -59 |
| 2015 | 283 | 319 | 463 | 96 | 662 | 1,339 | 2,770 | 2,213 | 1,422 | 1,522 | 1,094 | 577 |
| 2016 | 302 | 439 | 1,164 | 306 | 1,410 | 3,163 | 2,416 | 3,397 | 2,241 | 1,049 | 907 | 651 |
| 2017 | 1,284 | 1,266 | 655 | 849 | 1,491 | 2,806 | 2,780 | 2,193 | 119 | 781 | 889 | 193 |
| 2018 | 842 | 1,951 | 149 | 620 | 504 | 3,624 | 2,658 | 2,941 | 1,160 | 1,084 | 620 | 868 |
| 2019 | 796 | -979 | 173 | 328 | 5,024 | 5,077 | 2,658 | 3,809 | 1,952 | -582 | 604 | 202 |
| 2020 | 222 | 1,054 | 643 | 719 | 565 | 1,769 | 895 | 1,259 | -125 | 156 | -45 | 383 |
| 2021 | -131 | -2,332 | -1,354 | 136 | 3,598 | 2,976 | 2,604 | 851 | -112 | -958 | -685 | -1,279 |
| 2022 | -997 | -1,845 | -2,416 | -492 | 295 | 789 | 2,208 | 719 | -1,091 | -1,456 | -1,493 | -1,107 |
| 2023 | -1,129 | 25 | -2,025 | -68 | 1,742 | 2,277 | 2,392 | 1,984 | 975 | -706 | -1,590 | -2,248 |
| 2024 | -1,102 | |||||||||||
| - = No Data Reported; -- = Not Applicable; NA = Not Available; W = Withheld to avoid disclosure of individual company data. |
| Release Date: 3/29/2024 |
| Next Release Date: 4/30/2024 |