|
Download Data (XLS File) |
|
||||||||
|
||||||||
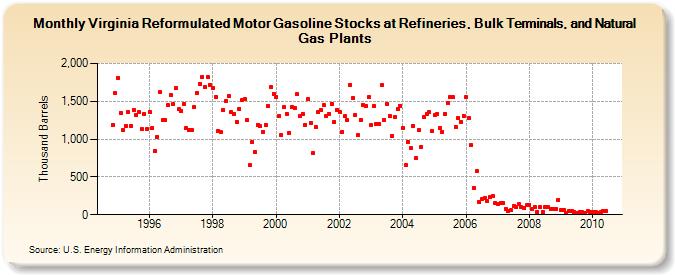
| Virginia Reformulated Motor Gasoline Stocks at Refineries, Bulk Terminals, and Natural Gas Plants (Thousand Barrels) | ||||||||
| Year | Jan | Feb | Mar | Apr | May | Jun | Jul | Aug | Sep | Oct | Nov | Dec |
|---|---|---|---|---|---|---|---|---|---|---|---|---|
| 1994 | 1,187 | 1,606 | ||||||||||
| 1995 | 1,813 | 1,351 | 1,117 | 1,176 | 1,358 | 1,179 | 1,390 | 1,319 | 1,358 | 1,136 | 1,331 | 1,130 |
| 1996 | 1,364 | 1,145 | 844 | 1,029 | 1,619 | 1,248 | 1,252 | 1,446 | 1,582 | 1,459 | 1,670 | 1,393 |
| 1997 | 1,374 | 1,465 | 1,143 | 1,120 | 1,122 | 1,423 | 1,611 | 1,731 | 1,823 | 1,693 | 1,824 | 1,718 |
| 1998 | 1,682 | 1,555 | 1,112 | 1,097 | 1,387 | 1,502 | 1,568 | 1,353 | 1,338 | 1,230 | 1,404 | 1,519 |
| 1999 | 1,527 | 1,254 | 651 | 959 | 833 | 1,188 | 1,171 | 1,097 | 1,184 | 1,435 | 1,683 | 1,597 |
| 2000 | 1,560 | 1,310 | 1,053 | 1,420 | 1,334 | 1,081 | 1,427 | 1,410 | 1,590 | 1,310 | 1,337 | 1,193 |
| 2001 | 1,524 | 1,213 | 816 | 1,157 | 1,356 | 1,381 | 1,447 | 1,299 | 1,336 | 1,470 | 1,232 | 1,390 |
| 2002 | 1,363 | 1,100 | 1,301 | 1,247 | 1,717 | 1,546 | 1,321 | 1,048 | 1,259 | 1,448 | 1,439 | 1,555 |
| 2003 | 1,184 | 1,439 | 1,204 | 1,200 | 1,711 | 1,254 | 1,468 | 1,303 | 1,047 | 1,293 | 1,399 | 1,441 |
| 2004 | 1,150 | 651 | 966 | 880 | 1,175 | 749 | 1,115 | 900 | 1,296 | 1,333 | 1,353 | 1,103 |
| 2005 | 1,313 | 1,334 | 1,142 | 1,099 | 1,336 | 1,474 | 1,552 | 1,551 | 1,165 | 1,279 | 1,231 | 1,307 |
| 2006 | 1,554 | 1,273 | 919 | 359 | 576 | 165 | 204 | 221 | 183 | 230 | 241 | 158 |
| 2007 | 146 | 151 | 151 | 78 | 43 | 57 | 114 | 102 | 136 | 100 | 84 | 122 |
| 2008 | 134 | 81 | 108 | 40 | 101 | 33 | 108 | 97 | 72 | 75 | 74 | 199 |
| 2009 | 58 | 64 | 25 | 48 | 52 | 37 | 27 | 40 | 35 | 22 | 44 | 34 |
| 2010 | 30 | 36 | 25 | 37 | 43 | 51 | ||||||
| 2011 | 41 | 35 | ||||||||||
| - = No Data Reported; -- = Not Applicable; NA = Not Available; W = Withheld to avoid disclosure of individual company data. |
| Release Date: 3/29/2024 |
| Next Release Date: 4/30/2024 |