|
Download Data (XLS File) |
|
||||||||
|
||||||||
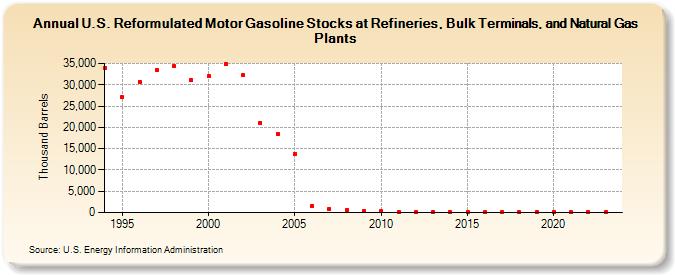
| U.S. Reformulated Motor Gasoline Stocks at Refineries, Bulk Terminals, and Natural Gas Plants (Thousand Barrels) | ||||||||
| Decade | Year-0 | Year-1 | Year-2 | Year-3 | Year-4 | Year-5 | Year-6 | Year-7 | Year-8 | Year-9 |
|---|---|---|---|---|---|---|---|---|---|---|
| 1990's | 34,046 | 27,144 | 30,729 | 33,374 | 34,362 | 31,115 | ||||
| 2000's | 31,989 | 34,866 | 32,257 | 21,101 | 18,533 | 13,860 | 1,566 | 810 | 495 | 364 |
| 2010's | 255 | 175 | 43 | 48 | 38 | 30 | 47 | 40 | 44 | 41 |
| 2020's | 48 | 22 | 20 | 22 |
| - = No Data Reported; -- = Not Applicable; NA = Not Available; W = Withheld to avoid disclosure of individual company data. |
| Release Date: 8/30/2024 |
| Next Release Date: 8/29/2025 |