|
Download Data (XLS File) |
|
||||||||
|
||||||||
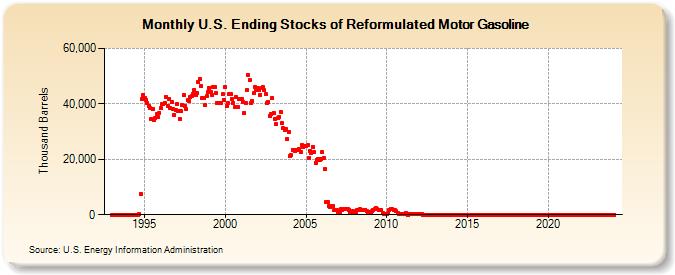
| U.S. Ending Stocks of Reformulated Motor Gasoline (Thousand Barrels) | ||||||||
| Year | Jan | Feb | Mar | Apr | May | Jun | Jul | Aug | Sep | Oct | Nov | Dec |
|---|---|---|---|---|---|---|---|---|---|---|---|---|
| 1993 | 0 | 0 | 0 | 0 | 0 | 0 | 0 | 0 | 0 | 0 | 0 | 0 |
| 1994 | 0 | 0 | 0 | 0 | 0 | 0 | 0 | 0 | 354 | 7,517 | 41,793 | 43,125 |
| 1995 | 42,263 | 41,402 | 40,334 | 39,307 | 38,567 | 34,505 | 38,106 | 34,323 | 34,816 | 36,188 | 35,290 | 36,797 |
| 1996 | 38,341 | 39,882 | 39,804 | 40,152 | 42,587 | 39,328 | 41,850 | 38,547 | 40,543 | 37,964 | 36,131 | 37,831 |
| 1997 | 39,972 | 37,542 | 34,499 | 37,272 | 39,663 | 43,134 | 39,254 | 38,213 | 41,315 | 40,867 | 42,445 | 42,931 |
| 1998 | 43,612 | 45,006 | 43,198 | 43,920 | 47,698 | 48,797 | 46,260 | 41,939 | 42,080 | 39,596 | 42,693 | 44,264 |
| 1999 | 45,883 | 44,432 | 43,139 | 46,120 | 46,220 | 43,954 | 40,257 | 40,178 | 40,395 | 40,396 | 43,420 | 41,437 |
| 2000 | 46,018 | 39,061 | 40,318 | 43,705 | 43,470 | 41,696 | 40,354 | 38,911 | 42,450 | 38,698 | 41,631 | 41,885 |
| 2001 | 41,586 | 40,496 | 36,733 | 40,254 | 44,861 | 50,534 | 48,596 | 40,346 | 40,986 | 43,896 | 46,041 | 44,918 |
| 2002 | 45,577 | 45,107 | 43,249 | 45,736 | 45,893 | 44,873 | 43,454 | 40,182 | 40,570 | 35,620 | 36,257 | 42,161 |
| 2003 | 36,761 | 34,557 | 32,601 | 34,939 | 35,373 | 37,023 | 32,991 | 31,187 | 30,444 | 30,817 | 27,285 | 30,006 |
| 2004 | 21,180 | 21,378 | 23,363 | 23,255 | 22,853 | 23,180 | 23,253 | 23,535 | 22,723 | 25,184 | 24,422 | 24,802 |
| 2005 | 24,702 | 25,040 | 20,282 | 23,104 | 22,297 | 24,594 | 22,569 | 18,824 | 19,848 | 20,203 | 19,830 | 20,037 |
| 2006 | 22,480 | 20,534 | 16,352 | 4,741 | 4,579 | 3,208 | 2,863 | 3,111 | 3,000 | 1,636 | 1,661 | 1,601 |
| 2007 | 1,051 | 996 | 1,965 | 1,789 | 2,053 | 2,061 | 2,012 | 1,895 | 1,761 | 1,152 | 938 | 1,224 |
| 2008 | 1,013 | 760 | 1,669 | 1,864 | 1,937 | 1,801 | 1,806 | 1,870 | 1,831 | 1,195 | 739 | 869 |
| 2009 | 698 | 1,164 | 1,624 | 2,066 | 2,284 | 1,934 | 1,830 | 1,544 | 1,532 | 439 | 358 | 383 |
| 2010 | 399 | 526 | 1,675 | 2,083 | 2,033 | 1,756 | 1,525 | 1,202 | 571 | 204 | 178 | 255 |
| 2011 | 364 | 210 | 749 | 300 | 67 | 103 | 109 | 167 | 170 | 119 | 177 | 202 |
| 2012 | 260 | 266 | 273 | 36 | 39 | 31 | 20 | 45 | 38 | 26 | 19 | 43 |
| 2013 | 29 | 23 | 38 | 34 | 44 | 28 | 29 | 32 | 43 | 40 | 41 | 48 |
| 2014 | 39 | 43 | 45 | 43 | 42 | 42 | 38 | 45 | 47 | 36 | 42 | 38 |
| 2015 | 38 | 31 | 34 | 39 | 27 | 44 | 32 | 31 | 39 | 39 | 46 | 30 |
| 2016 | 37 | 40 | 32 | 32 | 50 | 43 | 44 | 48 | 47 | 43 | 44 | 47 |
| 2017 | 55 | 55 | 45 | 46 | 46 | 50 | 53 | 47 | 43 | 44 | 47 | 40 |
| 2018 | 48 | 45 | 45 | 34 | 36 | 56 | 49 | 44 | 52 | 52 | 47 | 44 |
| 2019 | 46 | 31 | 44 | 39 | 46 | 34 | 48 | 52 | 49 | 40 | 48 | 41 |
| 2020 | 50 | 46 | 51 | 50 | 48 | 44 | 53 | 47 | 44 | 52 | 52 | 48 |
| 2021 | 38 | 45 | 24 | 22 | 24 | 22 | 19 | 23 | 26 | 25 | 20 | 22 |
| 2022 | 18 | 19 | 31 | 29 | 31 | 32 | 22 | 23 | 26 | 28 | 23 | 20 |
| 2023 | 23 | 22 | 21 | 26 | 22 | 24 | 19 | 15 | 20 | 22 | 22 | 22 |
| 2024 | 19 | |||||||||||
| - = No Data Reported; -- = Not Applicable; NA = Not Available; W = Withheld to avoid disclosure of individual company data. |
| Release Date: 3/29/2024 |
| Next Release Date: 4/30/2024 |