|
Download Data (XLS File) |
|
||||||||
|
||||||||
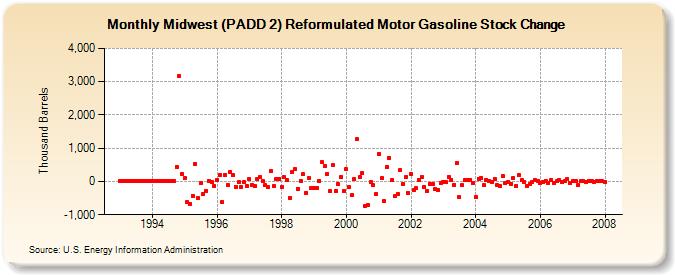
| Midwest (PADD 2) Reformulated Motor Gasoline Stock Change (Thousand Barrels) | ||||||||
| Year | Jan | Feb | Mar | Apr | May | Jun | Jul | Aug | Sep | Oct | Nov | Dec |
|---|---|---|---|---|---|---|---|---|---|---|---|---|
| 1993 | 0 | 0 | 0 | 0 | 0 | 0 | 0 | 0 | 0 | 0 | 0 | 0 |
| 1994 | 0 | 0 | 0 | 0 | 0 | 0 | 0 | 0 | 0 | 448 | 3,161 | 227 |
| 1995 | 92 | -624 | -664 | -426 | 525 | -507 | -47 | -363 | -285 | 19 | -29 | -138 |
| 1996 | 57 | 204 | -613 | 207 | -106 | 278 | 193 | -153 | -29 | -173 | -31 | -123 |
| 1997 | 76 | -106 | -122 | 72 | 138 | 12 | -119 | -163 | 300 | -138 | 60 | 85 |
| 1998 | -160 | 124 | 33 | -484 | 295 | 360 | -215 | 8 | 216 | -342 | 90 | -211 |
| 1999 | -197 | -190 | 10 | 573 | 454 | 231 | -289 | 485 | -290 | -88 | 132 | -292 |
| 2000 | 365 | -176 | -411 | 63 | 1,265 | 135 | 248 | -734 | -704 | -31 | -121 | -375 |
| 2001 | 824 | 91 | -600 | 427 | 719 | 30 | -438 | -374 | 347 | -91 | 136 | -336 |
| 2002 | 223 | -269 | -208 | 57 | 134 | -173 | -275 | -80 | -73 | -221 | -257 | -48 |
| 2003 | -6 | -31 | 144 | 53 | -94 | 548 | -479 | -115 | 36 | 52 | 55 | -56 |
| 2004 | -472 | 88 | 102 | -108 | 44 | 21 | -23 | 79 | -120 | -139 | 154 | -55 |
| 2005 | -4 | -75 | 100 | -137 | 186 | 36 | -13 | -131 | -79 | -6 | 29 | 26 |
| 2006 | -37 | -30 | 17 | -54 | 38 | -32 | -1 | 47 | -26 | 7 | 62 | -39 |
| 2007 | 8 | 9 | -95 | 1 | 5 | -3 | 0 | 4 | -2 | 1 | -1 | 2 |
| 2008 | -8 | |||||||||||
| - = No Data Reported; -- = Not Applicable; NA = Not Available; W = Withheld to avoid disclosure of individual company data. |
| Release Date: 3/29/2024 |
| Next Release Date: 4/30/2024 |