|
Download Data (XLS File) |
|
||||||||
|
||||||||
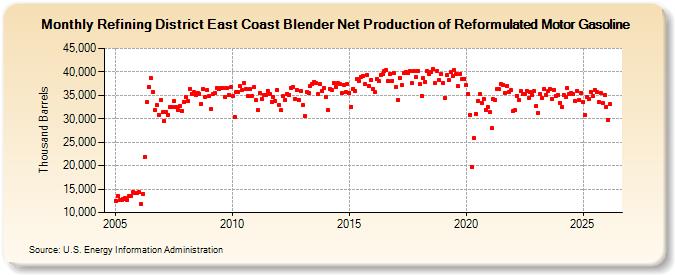
| Refining District East Coast Blender Net Production of Reformulated Motor Gasoline (Thousand Barrels) | ||||||||
| Year | Jan | Feb | Mar | Apr | May | Jun | Jul | Aug | Sep | Oct | Nov | Dec |
|---|---|---|---|---|---|---|---|---|---|---|---|---|
| 2005 | 12,539 | 13,629 | 12,574 | 12,778 | 12,799 | 13,156 | 12,756 | 13,475 | 13,576 | 14,379 | 14,201 | 14,138 |
| 2006 | 14,349 | 11,806 | 14,037 | 21,933 | 33,491 | 36,814 | 38,784 | 35,802 | 31,864 | 32,831 | 30,850 | 33,944 |
| 2007 | 31,346 | 29,520 | 31,458 | 30,884 | 32,464 | 32,456 | 33,684 | 32,559 | 31,820 | 32,785 | 31,681 | 33,578 |
| 2008 | 34,560 | 33,856 | 36,419 | 35,331 | 35,642 | 35,097 | 35,519 | 35,346 | 33,211 | 36,385 | 34,668 | 36,088 |
| 2009 | 34,909 | 32,076 | 35,286 | 35,577 | 36,584 | 36,301 | 36,535 | 36,530 | 34,704 | 36,618 | 35,074 | 36,733 |
| 2010 | 34,748 | 30,446 | 35,713 | 35,649 | 36,927 | 36,108 | 37,668 | 36,361 | 34,749 | 36,264 | 34,897 | 36,723 |
| 2011 | 34,023 | 31,853 | 35,566 | 34,304 | 35,130 | 35,136 | 35,991 | 35,322 | 33,573 | 34,701 | 33,857 | 36,156 |
| 2012 | 32,914 | 31,783 | 34,837 | 33,909 | 35,339 | 35,137 | 36,588 | 36,857 | 34,297 | 36,212 | 33,896 | 35,850 |
| 2013 | 32,885 | 30,634 | 35,668 | 35,424 | 37,060 | 37,327 | 37,875 | 37,520 | 35,296 | 37,403 | 35,928 | 36,560 |
| 2014 | 34,658 | 31,804 | 36,407 | 36,123 | 37,706 | 36,860 | 37,591 | 37,332 | 35,416 | 37,214 | 35,626 | 37,413 |
| 2015 | 35,560 | 32,539 | 36,434 | 35,933 | 38,513 | 38,011 | 38,973 | 39,090 | 37,302 | 39,348 | 36,967 | 38,227 |
| 2016 | 36,269 | 35,606 | 38,536 | 38,006 | 39,361 | 39,482 | 40,149 | 40,383 | 37,999 | 39,621 | 38,138 | 39,761 |
| 2017 | 36,703 | 34,068 | 38,757 | 37,153 | 39,816 | 40,029 | 39,790 | 40,177 | 37,586 | 40,075 | 38,843 | 40,239 |
| 2018 | 37,311 | 34,931 | 38,621 | 37,931 | 40,101 | 39,572 | 39,983 | 40,634 | 37,550 | 40,204 | 38,316 | 39,498 |
| 2019 | 37,653 | 34,376 | 39,225 | 38,160 | 39,948 | 39,145 | 40,326 | 39,563 | 36,908 | 39,609 | 38,446 | 38,574 |
| 2020 | 37,115 | 35,339 | 30,851 | 19,679 | 25,871 | 31,085 | 33,794 | 35,250 | 33,413 | 34,314 | 31,969 | 32,589 |
| 2021 | 31,365 | 27,956 | 34,163 | 34,059 | 36,388 | 36,247 | 37,451 | 37,272 | 35,582 | 37,080 | 35,658 | 36,044 |
| 2022 | 31,587 | 31,781 | 34,915 | 34,079 | 35,820 | 35,217 | 35,314 | 35,985 | 34,477 | 35,675 | 35,061 | 35,863 |
| 2023 | 32,767 | 31,412 | 35,411 | 34,561 | 36,615 | 35,126 | 35,815 | 36,302 | 34,306 | 36,209 | 34,913 | 35,100 |
| 2024 | 33,465 | |||||||||||
| - = No Data Reported; -- = Not Applicable; NA = Not Available; W = Withheld to avoid disclosure of individual company data. |
| Release Date: 3/29/2024 |
| Next Release Date: 4/30/2024 |