|
Download Data (XLS File) |
|
||||||||
|
||||||||
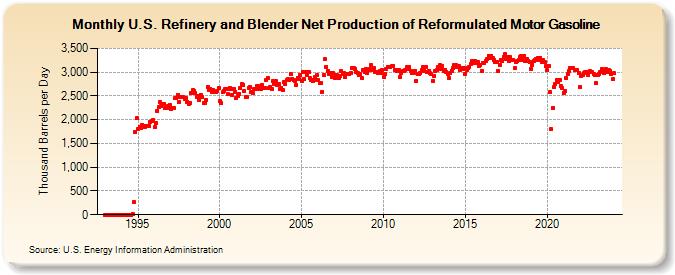
| U.S. Refinery and Blender Net Production of Reformulated Motor Gasoline (Thousand Barrels per Day) | ||||||||
| Year | Jan | Feb | Mar | Apr | May | Jun | Jul | Aug | Sep | Oct | Nov | Dec |
|---|---|---|---|---|---|---|---|---|---|---|---|---|
| 1993 | 0 | 0 | 0 | 0 | 0 | 0 | 0 | 0 | 0 | 0 | 0 | 0 |
| 1994 | 0 | 0 | 0 | 0 | 0 | 0 | 0 | 0 | 21 | 263 | 1,741 | 2,034 |
| 1995 | 1,799 | 1,856 | 1,821 | 1,894 | 1,866 | 1,837 | 1,869 | 1,860 | 1,870 | 1,953 | 1,978 | 1,998 |
| 1996 | 1,843 | 1,923 | 2,188 | 2,262 | 2,366 | 2,278 | 2,330 | 2,332 | 2,256 | 2,247 | 2,297 | 2,314 |
| 1997 | 2,217 | 2,253 | 2,251 | 2,447 | 2,449 | 2,525 | 2,376 | 2,484 | 2,483 | 2,481 | 2,442 | 2,458 |
| 1998 | 2,381 | 2,329 | 2,355 | 2,558 | 2,618 | 2,606 | 2,560 | 2,484 | 2,498 | 2,410 | 2,521 | 2,475 |
| 1999 | 2,341 | 2,348 | 2,419 | 2,697 | 2,630 | 2,655 | 2,592 | 2,632 | 2,582 | 2,583 | 2,610 | 2,672 |
| 2000 | 2,386 | 2,342 | 2,573 | 2,594 | 2,635 | 2,645 | 2,533 | 2,672 | 2,651 | 2,523 | 2,650 | 2,592 |
| 2001 | 2,459 | 2,503 | 2,547 | 2,666 | 2,748 | 2,733 | 2,611 | 2,475 | 2,478 | 2,671 | 2,688 | 2,577 |
| 2002 | 2,558 | 2,636 | 2,641 | 2,706 | 2,707 | 2,644 | 2,640 | 2,725 | 2,658 | 2,657 | 2,832 | 2,877 |
| 2003 | 2,671 | 2,686 | 2,641 | 2,806 | 2,752 | 2,808 | 2,726 | 2,753 | 2,643 | 2,664 | 2,624 | 2,800 |
| 2004 | 2,749 | 2,830 | 2,848 | 2,827 | 2,960 | 2,862 | 2,828 | 2,811 | 2,726 | 2,887 | 2,849 | 2,944 |
| 2005 | 2,804 | 2,997 | 2,850 | 3,003 | 2,947 | 3,001 | 2,868 | 2,827 | 2,822 | 2,840 | 2,899 | 2,936 |
| 2006 | 2,838 | 2,766 | 2,767 | 2,590 | 2,937 | 3,271 | 3,110 | 3,027 | 2,956 | 2,983 | 2,906 | 2,976 |
| 2007 | 2,876 | 2,946 | 2,930 | 2,872 | 2,923 | 3,016 | 2,966 | 2,974 | 2,900 | 2,971 | 2,955 | 2,970 |
| 2008 | 2,980 | 3,089 | 3,087 | 3,061 | 3,004 | 2,981 | 2,933 | 2,953 | 2,879 | 3,036 | 2,995 | 3,067 |
| 2009 | 2,974 | 3,037 | 3,075 | 3,141 | 3,035 | 3,080 | 3,008 | 3,000 | 2,989 | 3,024 | 2,972 | 3,045 |
| 2010 | 2,888 | 2,951 | 3,065 | 3,113 | 3,109 | 3,101 | 3,120 | 3,134 | 3,049 | 3,039 | 3,027 | 3,045 |
| 2011 | 2,896 | 2,987 | 3,021 | 3,025 | 3,052 | 3,107 | 3,061 | 3,104 | 3,034 | 2,980 | 2,988 | 3,033 |
| 2012 | 2,816 | 2,955 | 2,960 | 2,972 | 3,042 | 3,103 | 3,034 | 3,113 | 3,004 | 3,032 | 2,972 | 2,954 |
| 2013 | 2,818 | 2,928 | 3,019 | 3,048 | 3,117 | 3,143 | 3,074 | 3,130 | 3,031 | 3,054 | 3,011 | 2,963 |
| 2014 | 2,880 | 2,973 | 3,032 | 3,084 | 3,150 | 3,143 | 3,102 | 3,135 | 3,055 | 3,094 | 3,059 | 3,078 |
| 2015 | 2,969 | 3,049 | 3,088 | 3,116 | 3,174 | 3,237 | 3,200 | 3,239 | 3,194 | 3,214 | 3,122 | 3,142 |
| 2016 | 3,025 | 3,193 | 3,194 | 3,239 | 3,275 | 3,346 | 3,306 | 3,348 | 3,293 | 3,257 | 3,214 | 3,222 |
| 2017 | 3,027 | 3,152 | 3,264 | 3,233 | 3,321 | 3,374 | 3,275 | 3,319 | 3,230 | 3,309 | 3,257 | 3,260 |
| 2018 | 3,077 | 3,219 | 3,244 | 3,247 | 3,324 | 3,339 | 3,258 | 3,350 | 3,228 | 3,280 | 3,237 | 3,210 |
| 2019 | 3,076 | 3,156 | 3,225 | 3,259 | 3,279 | 3,306 | 3,264 | 3,305 | 3,219 | 3,256 | 3,204 | 3,126 |
| 2020 | 3,041 | 3,136 | 2,576 | 1,797 | 2,249 | 2,681 | 2,752 | 2,845 | 2,798 | 2,830 | 2,700 | 2,662 |
| 2021 | 2,563 | 2,602 | 2,869 | 2,966 | 3,024 | 3,092 | 3,091 | 3,092 | 3,050 | 3,049 | 3,035 | 2,976 |
| 2022 | 2,686 | 2,925 | 2,950 | 2,973 | 3,012 | 3,010 | 2,930 | 3,017 | 3,009 | 2,996 | 2,971 | 2,937 |
| 2023 | 2,770 | 2,934 | 2,969 | 3,006 | 3,059 | 3,050 | 2,979 | 3,059 | 2,996 | 3,046 | 3,032 | 2,960 |
| 2024 | 2,853 | |||||||||||
| - = No Data Reported; -- = Not Applicable; NA = Not Available; W = Withheld to avoid disclosure of individual company data. |
| Release Date: 3/29/2024 |
| Next Release Date: 4/30/2024 |