|
Download Data (XLS File) |
|
||||||||
|
||||||||
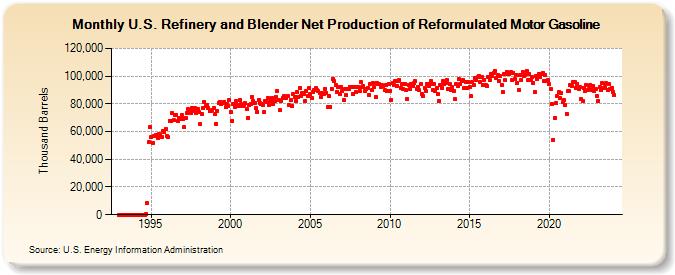
| U.S. Refinery and Blender Net Production of Reformulated Motor Gasoline (Thousand Barrels) | ||||||||
| Year | Jan | Feb | Mar | Apr | May | Jun | Jul | Aug | Sep | Oct | Nov | Dec |
|---|---|---|---|---|---|---|---|---|---|---|---|---|
| 1993 | 0 | 0 | 0 | 0 | 0 | 0 | 0 | 0 | 0 | 0 | 0 | 0 |
| 1994 | 0 | 0 | 0 | 0 | 0 | 0 | 0 | 0 | 627 | 8,163 | 52,221 | 63,063 |
| 1995 | 55,772 | 51,971 | 56,461 | 56,823 | 57,860 | 55,110 | 57,938 | 57,662 | 56,108 | 60,528 | 59,344 | 61,926 |
| 1996 | 57,130 | 55,763 | 67,817 | 67,871 | 73,338 | 68,332 | 72,228 | 72,291 | 67,677 | 69,662 | 68,909 | 71,732 |
| 1997 | 68,717 | 63,097 | 69,771 | 73,406 | 75,921 | 75,764 | 73,653 | 76,997 | 74,503 | 76,914 | 73,257 | 76,200 |
| 1998 | 73,798 | 65,207 | 72,999 | 76,726 | 81,149 | 78,169 | 79,350 | 76,996 | 74,930 | 74,720 | 75,644 | 76,731 |
| 1999 | 72,561 | 65,755 | 74,981 | 80,915 | 81,525 | 79,651 | 80,358 | 81,592 | 77,462 | 80,084 | 78,291 | 82,827 |
| 2000 | 73,981 | 67,932 | 79,758 | 77,829 | 81,691 | 79,351 | 78,527 | 82,818 | 79,526 | 78,211 | 79,508 | 80,361 |
| 2001 | 76,233 | 70,079 | 78,970 | 79,966 | 85,185 | 82,004 | 80,936 | 76,717 | 74,326 | 82,811 | 80,626 | 79,892 |
| 2002 | 79,302 | 73,817 | 81,865 | 81,181 | 83,905 | 79,328 | 81,855 | 84,479 | 79,730 | 82,366 | 84,956 | 89,194 |
| 2003 | 82,813 | 75,194 | 81,878 | 84,189 | 85,305 | 84,241 | 84,499 | 85,347 | 79,281 | 82,591 | 78,707 | 86,806 |
| 2004 | 85,225 | 82,077 | 88,274 | 84,803 | 91,774 | 85,847 | 87,654 | 87,146 | 81,767 | 89,501 | 85,477 | 91,277 |
| 2005 | 86,911 | 83,910 | 88,350 | 90,090 | 91,353 | 90,039 | 88,915 | 87,627 | 84,666 | 88,027 | 86,977 | 91,031 |
| 2006 | 87,979 | 77,458 | 85,763 | 77,712 | 91,042 | 98,119 | 96,397 | 93,848 | 88,685 | 92,479 | 87,183 | 92,264 |
| 2007 | 89,154 | 82,478 | 90,820 | 86,153 | 90,610 | 90,486 | 91,953 | 92,193 | 87,012 | 92,099 | 88,646 | 92,061 |
| 2008 | 92,389 | 89,589 | 95,691 | 91,836 | 93,130 | 89,440 | 90,929 | 91,537 | 86,377 | 94,131 | 89,847 | 95,062 |
| 2009 | 92,192 | 85,043 | 95,324 | 94,236 | 94,085 | 92,406 | 93,252 | 93,006 | 89,667 | 93,749 | 89,167 | 94,405 |
| 2010 | 89,524 | 82,638 | 95,004 | 93,382 | 96,389 | 93,031 | 96,709 | 97,168 | 91,472 | 94,215 | 90,801 | 94,405 |
| 2011 | 89,774 | 83,645 | 93,646 | 90,760 | 94,599 | 93,212 | 94,889 | 96,219 | 91,015 | 92,368 | 89,632 | 94,035 |
| 2012 | 87,284 | 85,683 | 91,768 | 89,171 | 94,297 | 93,094 | 94,044 | 96,506 | 90,132 | 93,986 | 89,164 | 91,580 |
| 2013 | 87,358 | 81,970 | 93,590 | 91,451 | 96,626 | 94,304 | 95,281 | 97,037 | 90,937 | 94,662 | 90,332 | 91,846 |
| 2014 | 89,271 | 83,247 | 93,999 | 92,514 | 97,643 | 94,288 | 96,152 | 97,200 | 91,642 | 95,925 | 91,782 | 95,403 |
| 2015 | 92,025 | 85,376 | 95,715 | 93,467 | 98,409 | 97,109 | 99,187 | 100,421 | 95,805 | 99,632 | 93,670 | 97,415 |
| 2016 | 93,767 | 92,588 | 99,001 | 97,155 | 101,520 | 100,377 | 102,484 | 103,788 | 98,781 | 100,953 | 96,419 | 99,881 |
| 2017 | 93,844 | 88,255 | 101,183 | 96,999 | 102,956 | 101,218 | 101,522 | 102,882 | 96,897 | 102,580 | 97,696 | 101,072 |
| 2018 | 95,378 | 90,131 | 100,569 | 97,423 | 103,042 | 100,161 | 100,991 | 103,842 | 96,843 | 101,677 | 97,120 | 99,500 |
| 2019 | 95,354 | 88,376 | 99,963 | 97,762 | 101,638 | 99,177 | 101,198 | 102,464 | 96,555 | 100,932 | 96,126 | 96,907 |
| 2020 | 94,279 | 90,934 | 79,842 | 53,919 | 69,704 | 80,421 | 85,299 | 88,190 | 83,952 | 87,719 | 81,013 | 82,519 |
| 2021 | 79,467 | 72,868 | 88,929 | 88,988 | 93,740 | 92,770 | 95,821 | 95,845 | 91,489 | 94,516 | 91,038 | 92,250 |
| 2022 | 83,251 | 81,893 | 91,459 | 89,176 | 93,374 | 90,310 | 90,834 | 93,526 | 90,256 | 92,880 | 89,122 | 91,036 |
| 2023 | 85,865 | 82,143 | 92,041 | 90,187 | 94,842 | 91,506 | 92,352 | 94,831 | 89,893 | 94,426 | 90,945 | 91,763 |
| 2024 | 88,429 | |||||||||||
| - = No Data Reported; -- = Not Applicable; NA = Not Available; W = Withheld to avoid disclosure of individual company data. |
| Release Date: 3/29/2024 |
| Next Release Date: 4/30/2024 |