|
Download Data (XLS File) |
|
||||||||
|
||||||||
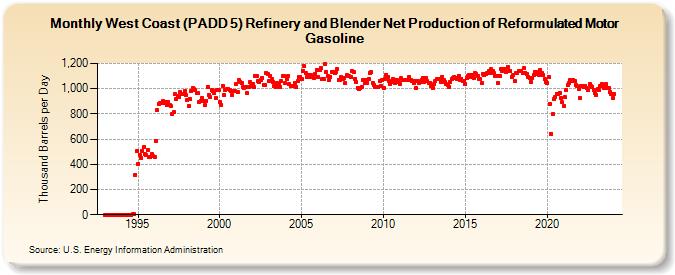
| West Coast (PADD 5) Refinery and Blender Net Production of Reformulated Motor Gasoline (Thousand Barrels per Day) | ||||||||
| Year | Jan | Feb | Mar | Apr | May | Jun | Jul | Aug | Sep | Oct | Nov | Dec |
|---|---|---|---|---|---|---|---|---|---|---|---|---|
| 1993 | 0 | 0 | 0 | 0 | 0 | 0 | 0 | 0 | 0 | 0 | 0 | 0 |
| 1994 | 0 | 0 | 0 | 0 | 0 | 0 | 0 | 0 | 9 | 4 | 318 | 505 |
| 1995 | 403 | 477 | 452 | 509 | 534 | 480 | 475 | 511 | 458 | 458 | 481 | 464 |
| 1996 | 458 | 586 | 828 | 878 | 883 | 886 | 900 | 888 | 896 | 869 | 896 | 869 |
| 1997 | 859 | 800 | 812 | 956 | 915 | 945 | 936 | 972 | 955 | 959 | 981 | 948 |
| 1998 | 910 | 866 | 920 | 979 | 1,008 | 999 | 989 | 967 | 965 | 898 | 904 | 929 |
| 1999 | 901 | 870 | 905 | 1,014 | 950 | 933 | 988 | 982 | 965 | 923 | 988 | 990 |
| 2000 | 898 | 871 | 1,020 | 952 | 992 | 994 | 998 | 991 | 980 | 949 | 984 | 981 |
| 2001 | 1,039 | 971 | 1,065 | 1,056 | 1,043 | 1,014 | 1,009 | 1,011 | 963 | 1,014 | 1,053 | 1,021 |
| 2002 | 1,037 | 1,011 | 1,097 | 1,104 | 1,060 | 1,054 | 1,069 | 1,087 | 1,031 | 1,032 | 1,128 | 1,117 |
| 2003 | 1,062 | 1,099 | 1,080 | 1,057 | 1,023 | 1,010 | 1,043 | 1,040 | 1,013 | 1,062 | 1,104 | 1,102 |
| 2004 | 1,044 | 1,079 | 1,100 | 1,036 | 1,024 | 1,018 | 1,018 | 1,046 | 1,016 | 1,059 | 1,095 | 1,091 |
| 2005 | 1,074 | 1,140 | 1,178 | 1,121 | 1,091 | 1,107 | 1,095 | 1,106 | 1,102 | 1,088 | 1,120 | 1,148 |
| 2006 | 1,092 | 1,151 | 1,168 | 1,078 | 1,078 | 1,197 | 1,132 | 1,099 | 1,069 | 1,096 | 1,136 | 1,130 |
| 2007 | 1,125 | 1,132 | 1,153 | 1,067 | 1,072 | 1,091 | 1,076 | 1,085 | 1,042 | 1,105 | 1,098 | 1,097 |
| 2008 | 1,095 | 1,138 | 1,135 | 1,079 | 1,051 | 1,008 | 998 | 1,003 | 1,016 | 1,065 | 1,042 | 1,071 |
| 2009 | 1,049 | 1,077 | 1,127 | 1,133 | 1,046 | 1,027 | 1,016 | 1,011 | 1,013 | 1,059 | 1,024 | 1,067 |
| 2010 | 1,009 | 1,073 | 1,110 | 1,096 | 1,061 | 1,041 | 1,051 | 1,077 | 1,048 | 1,066 | 1,066 | 1,056 |
| 2011 | 1,035 | 1,082 | 1,070 | 1,068 | 1,065 | 1,072 | 1,072 | 1,092 | 1,072 | 1,059 | 1,049 | 1,063 |
| 2012 | 1,004 | 1,059 | 1,048 | 1,056 | 1,070 | 1,088 | 1,053 | 1,086 | 1,059 | 1,049 | 1,045 | 1,023 |
| 2013 | 1,007 | 1,040 | 1,064 | 1,075 | 1,078 | 1,075 | 1,056 | 1,095 | 1,067 | 1,053 | 1,034 | 1,032 |
| 2014 | 1,016 | 1,052 | 1,073 | 1,081 | 1,096 | 1,083 | 1,074 | 1,103 | 1,072 | 1,080 | 1,061 | 1,060 |
| 2015 | 1,039 | 1,085 | 1,100 | 1,108 | 1,093 | 1,110 | 1,087 | 1,123 | 1,114 | 1,104 | 1,075 | 1,079 |
| 2016 | 1,044 | 1,120 | 1,112 | 1,119 | 1,123 | 1,137 | 1,127 | 1,158 | 1,142 | 1,121 | 1,100 | 1,100 |
| 2017 | 1,048 | 1,097 | 1,153 | 1,140 | 1,158 | 1,158 | 1,135 | 1,173 | 1,142 | 1,138 | 1,095 | 1,105 |
| 2018 | 1,058 | 1,122 | 1,125 | 1,137 | 1,141 | 1,137 | 1,122 | 1,165 | 1,128 | 1,118 | 1,094 | 1,088 |
| 2019 | 1,057 | 1,088 | 1,106 | 1,133 | 1,117 | 1,132 | 1,111 | 1,151 | 1,126 | 1,110 | 1,074 | 1,056 |
| 2020 | 1,046 | 1,092 | 882 | 641 | 799 | 917 | 933 | 961 | 955 | 968 | 927 | 892 |
| 2021 | 863 | 932 | 989 | 1,026 | 1,047 | 1,065 | 1,061 | 1,066 | 1,058 | 1,033 | 1,018 | 1,001 |
| 2022 | 926 | 1,024 | 1,022 | 1,014 | 1,022 | 1,007 | 987 | 1,035 | 1,021 | 1,015 | 986 | 968 |
| 2023 | 948 | 998 | 991 | 1,023 | 1,034 | 1,030 | 1,009 | 1,036 | 1,007 | 1,007 | 973 | 959 |
| 2024 | 928 | |||||||||||
| - = No Data Reported; -- = Not Applicable; NA = Not Available; W = Withheld to avoid disclosure of individual company data. |
| Release Date: 3/29/2024 |
| Next Release Date: 4/30/2024 |