|
Download Data (XLS File) |
|
||||||||
|
||||||||
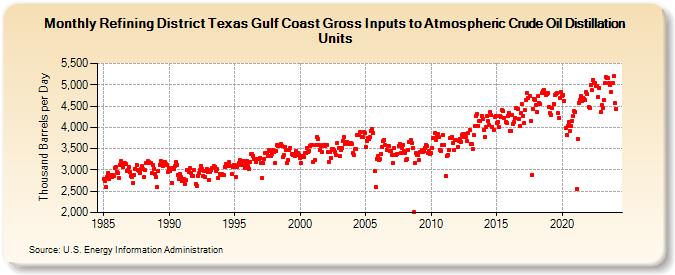
| Refining District Texas Gulf Coast Gross Inputs to Atmospheric Crude Oil Distillation Units (Thousand Barrels per Day) | ||||||||
| Year | Jan | Feb | Mar | Apr | May | Jun | Jul | Aug | Sep | Oct | Nov | Dec |
|---|---|---|---|---|---|---|---|---|---|---|---|---|
| 1985 | 2,792 | 2,749 | 2,601 | 2,831 | 2,936 | 2,799 | 2,884 | 2,830 | 2,893 | 2,870 | 3,050 | 3,071 |
| 1986 | 2,959 | 2,921 | 2,811 | 3,117 | 3,211 | 3,150 | 3,081 | 3,171 | 3,138 | 2,975 | 3,000 | 3,069 |
| 1987 | 2,956 | 2,856 | 2,829 | 2,690 | 2,890 | 3,034 | 3,119 | 2,998 | 2,967 | 2,933 | 3,019 | 3,082 |
| 1988 | 3,024 | 2,827 | 2,999 | 3,165 | 3,203 | 3,191 | 3,152 | 3,168 | 2,920 | 3,105 | 3,021 | 2,894 |
| 1989 | 2,829 | 2,599 | 2,970 | 3,117 | 3,211 | 3,195 | 3,083 | 3,129 | 3,184 | 3,151 | 3,118 | 2,952 |
| 1990 | 3,037 | 2,977 | 2,704 | 3,056 | 3,020 | 3,085 | 3,182 | 3,116 | 2,892 | 2,797 | 2,901 | 2,825 |
| 1991 | 2,743 | 2,793 | 2,671 | 2,755 | 2,994 | 3,003 | 2,958 | 3,037 | 2,923 | 2,864 | 2,864 | 2,993 |
| 1992 | 2,680 | 2,634 | 2,870 | 2,923 | 3,002 | 3,100 | 3,034 | 2,870 | 2,977 | 2,837 | 3,030 | 2,943 |
| 1993 | 2,762 | 2,957 | 3,002 | 3,036 | 3,036 | 3,085 | 3,077 | 2,972 | 3,016 | 2,805 | 2,901 | 2,891 |
| 1994 | 2,901 | 2,880 | 2,873 | 3,075 | 3,142 | 3,138 | 3,096 | 3,189 | 3,104 | 2,898 | 3,062 | 3,124 |
| 1995 | 3,083 | 2,842 | 3,065 | 3,107 | 3,175 | 3,232 | 3,218 | 3,116 | 3,213 | 3,048 | 3,147 | 3,200 |
| 1996 | 3,085 | 3,030 | 3,194 | 3,364 | 3,378 | 3,332 | 3,259 | 3,180 | 3,269 | 3,265 | 3,268 | 3,279 |
| 1997 | 3,157 | 2,821 | 3,155 | 3,267 | 3,407 | 3,397 | 3,339 | 3,465 | 3,443 | 3,326 | 3,380 | 3,463 |
| 1998 | 3,416 | 3,169 | 3,434 | 3,575 | 3,552 | 3,587 | 3,603 | 3,564 | 3,297 | 3,347 | 3,546 | 3,479 |
| 1999 | 3,161 | 3,225 | 3,474 | 3,522 | 3,382 | 3,347 | 3,370 | 3,328 | 3,450 | 3,354 | 3,395 | 3,361 |
| 2000 | 3,271 | 3,162 | 3,337 | 3,300 | 3,405 | 3,402 | 3,520 | 3,411 | 3,452 | 3,570 | 3,578 | 3,587 |
| 2001 | 3,196 | 3,231 | 3,576 | 3,771 | 3,734 | 3,595 | 3,470 | 3,560 | 3,431 | 3,595 | 3,596 | 3,570 |
| 2002 | 3,581 | 3,426 | 3,192 | 3,419 | 3,281 | 3,494 | 3,489 | 3,465 | 3,415 | 3,348 | 3,638 | 3,511 |
| 2003 | 3,318 | 3,477 | 3,518 | 3,688 | 3,783 | 3,599 | 3,651 | 3,660 | 3,631 | 3,617 | 3,634 | 3,610 |
| 2004 | 3,395 | 3,351 | 3,485 | 3,490 | 3,813 | 3,829 | 3,816 | 3,892 | 3,778 | 3,765 | 3,894 | 3,868 |
| 2005 | 3,539 | 3,688 | 3,759 | 3,720 | 3,771 | 3,910 | 3,957 | 3,862 | 2,965 | 2,604 | 3,262 | 3,318 |
| 2006 | 3,242 | 3,250 | 3,375 | 3,550 | 3,673 | 3,712 | 3,581 | 3,477 | 3,574 | 3,551 | 3,439 | 3,456 |
| 2007 | 3,349 | 3,161 | 3,507 | 3,340 | 3,351 | 3,384 | 3,573 | 3,617 | 3,396 | 3,519 | 3,587 | 3,439 |
| 2008 | 3,400 | 3,242 | 3,255 | 3,474 | 3,653 | 3,694 | 3,626 | 3,519 | 2,019 | 3,171 | 3,387 | 3,351 |
| 2009 | 3,346 | 3,242 | 3,423 | 3,473 | 3,427 | 3,454 | 3,526 | 3,593 | 3,553 | 3,397 | 3,436 | 3,365 |
| 2010 | 3,396 | 3,511 | 3,759 | 3,858 | 3,694 | 3,794 | 3,854 | 3,772 | 3,467 | 3,440 | 3,588 | 3,816 |
| 2011 | 3,592 | 2,859 | 3,322 | 3,359 | 3,478 | 3,741 | 3,742 | 3,785 | 3,639 | 3,475 | 3,708 | 3,703 |
| 2012 | 3,534 | 3,690 | 3,723 | 3,645 | 3,827 | 3,846 | 3,784 | 3,849 | 3,774 | 3,670 | 3,865 | 3,931 |
| 2013 | 3,612 | 3,599 | 3,492 | 3,820 | 4,035 | 4,259 | 4,313 | 4,042 | 4,148 | 4,159 | 4,277 | 4,192 |
| 2014 | 3,938 | 3,778 | 4,004 | 4,266 | 4,148 | 4,061 | 4,362 | 4,281 | 4,006 | 3,938 | 4,252 | 4,272 |
| 2015 | 4,108 | 4,120 | 4,001 | 4,274 | 4,233 | 4,398 | 4,374 | 4,223 | 4,133 | 4,095 | 4,275 | 4,344 |
| 2016 | 3,921 | 3,920 | 4,289 | 4,080 | 4,124 | 4,230 | 4,453 | 4,431 | 4,203 | 4,036 | 4,334 | 4,556 |
| 2017 | 4,272 | 4,106 | 4,412 | 4,637 | 4,801 | 4,683 | 4,726 | 4,158 | 2,893 | 4,428 | 4,674 | 4,647 |
| 2018 | 4,526 | 4,359 | 4,726 | 4,578 | 4,545 | 4,800 | 4,856 | 4,885 | 4,812 | 4,766 | 4,792 | 4,799 |
| 2019 | 4,483 | 4,330 | 4,299 | 4,445 | 4,550 | 4,755 | 4,780 | 4,810 | 4,345 | 4,210 | 4,684 | 4,825 |
| 2020 | 4,733 | 4,749 | 4,625 | 3,976 | 3,820 | 4,037 | 4,125 | 3,916 | 4,035 | 4,150 | 4,267 | 4,378 |
| 2021 | 4,365 | 2,563 | 3,737 | 4,578 | 4,648 | 4,725 | 4,617 | 4,699 | 4,671 | 4,631 | 4,836 | 4,772 |
| 2022 | 4,467 | 4,445 | 4,986 | 4,869 | 5,109 | 5,051 | 5,047 | 4,974 | 4,965 | 4,713 | 4,913 | 4,357 |
| 2023 | 4,516 | 4,456 | 4,639 | 5,035 | 5,179 | 5,166 | 5,149 | 5,040 | 4,985 | 4,829 | 5,039 | 5,197 |
| 2024 | 4,566 | |||||||||||
| - = No Data Reported; -- = Not Applicable; NA = Not Available; W = Withheld to avoid disclosure of individual company data. |
| Release Date: 3/29/2024 |
| Next Release Date: 4/30/2024 |