|
Download Data (XLS File) |
|
||||||||
|
||||||||
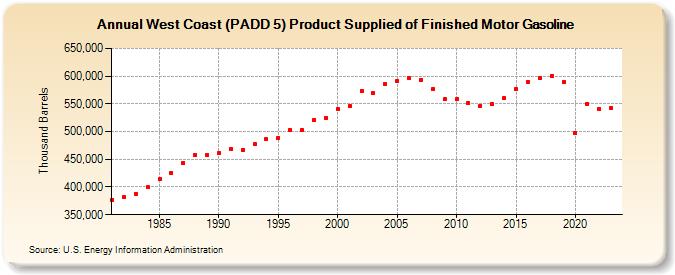
| West Coast (PADD 5) Product Supplied of Finished Motor Gasoline (Thousand Barrels) | ||||||||
| Decade | Year-0 | Year-1 | Year-2 | Year-3 | Year-4 | Year-5 | Year-6 | Year-7 | Year-8 | Year-9 |
|---|---|---|---|---|---|---|---|---|---|---|
| 1980's | 377,234 | 381,973 | 387,911 | 399,467 | 413,907 | 425,560 | 443,448 | 457,923 | 458,517 | |
| 1990's | 461,040 | 468,288 | 467,402 | 476,986 | 485,744 | 488,956 | 502,803 | 502,477 | 521,367 | 525,234 |
| 2000's | 541,385 | 546,791 | 573,732 | 569,339 | 585,445 | 591,792 | 596,247 | 593,499 | 576,369 | 557,831 |
| 2010's | 558,356 | 551,299 | 546,215 | 549,977 | 560,149 | 576,556 | 590,207 | 596,055 | 600,849 | 589,018 |
| 2020's | 497,741 | 550,170 | 540,706 | 543,318 |
| - = No Data Reported; -- = Not Applicable; NA = Not Available; W = Withheld to avoid disclosure of individual company data. |
| Release Date: 3/29/2024 |
| Next Release Date: 8/30/2024 |