|
Download Data (XLS File) |
|
||||||||
|
||||||||
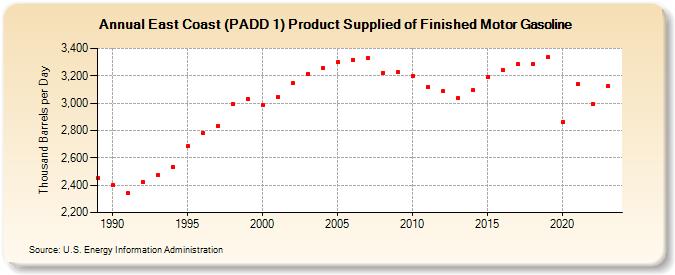
| East Coast (PADD 1) Product Supplied of Finished Motor Gasoline (Thousand Barrels per Day) | ||||||||
| Decade | Year-0 | Year-1 | Year-2 | Year-3 | Year-4 | Year-5 | Year-6 | Year-7 | Year-8 | Year-9 |
|---|---|---|---|---|---|---|---|---|---|---|
| 1980's | 2,449 | |||||||||
| 1990's | 2,399 | 2,340 | 2,423 | 2,474 | 2,532 | 2,684 | 2,779 | 2,835 | 2,991 | 3,029 |
| 2000's | 2,988 | 3,045 | 3,146 | 3,216 | 3,255 | 3,297 | 3,318 | 3,331 | 3,223 | 3,227 |
| 2010's | 3,199 | 3,119 | 3,085 | 3,035 | 3,093 | 3,188 | 3,243 | 3,284 | 3,285 | 3,334 |
| 2020's | 2,861 | 3,139 | 2,990 | 3,122 |
| - = No Data Reported; -- = Not Applicable; NA = Not Available; W = Withheld to avoid disclosure of individual company data. |
| Release Date: 3/29/2024 |
| Next Release Date: 8/30/2024 |