|
Download Data (XLS File) |
|
||||||||
|
||||||||
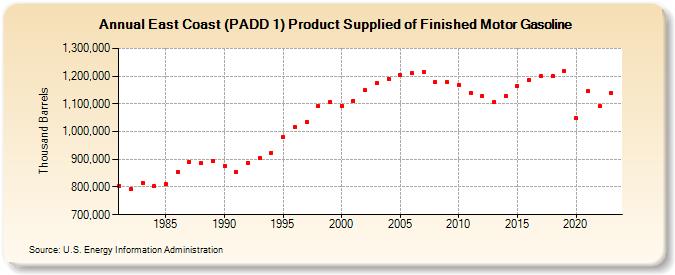
| East Coast (PADD 1) Product Supplied of Finished Motor Gasoline (Thousand Barrels) | ||||||||
| Decade | Year-0 | Year-1 | Year-2 | Year-3 | Year-4 | Year-5 | Year-6 | Year-7 | Year-8 | Year-9 |
|---|---|---|---|---|---|---|---|---|---|---|
| 1980's | 805,254 | 791,463 | 815,928 | 802,668 | 810,622 | 855,273 | 891,819 | 885,631 | 893,983 | |
| 1990's | 875,802 | 854,035 | 886,748 | 903,050 | 924,229 | 979,493 | 1,017,192 | 1,034,615 | 1,091,545 | 1,105,723 |
| 2000's | 1,093,596 | 1,111,595 | 1,148,283 | 1,173,956 | 1,191,330 | 1,203,396 | 1,211,088 | 1,215,865 | 1,179,604 | 1,177,870 |
| 2010's | 1,167,570 | 1,138,263 | 1,129,107 | 1,107,905 | 1,128,965 | 1,163,510 | 1,187,002 | 1,198,817 | 1,198,844 | 1,216,735 |
| 2020's | 1,047,277 | 1,145,681 | 1,091,387 | 1,139,630 |
| - = No Data Reported; -- = Not Applicable; NA = Not Available; W = Withheld to avoid disclosure of individual company data. |
| Release Date: 3/29/2024 |
| Next Release Date: 8/30/2024 |