|
Download Data (XLS File) |
|
||||||||
|
||||||||
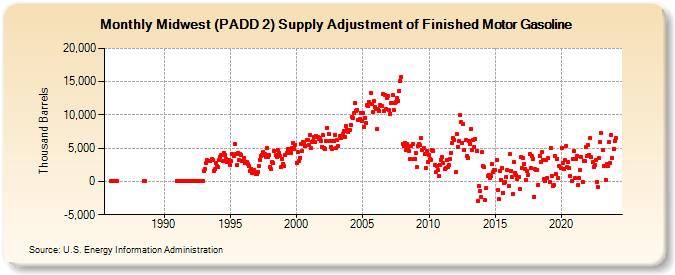
| Midwest (PADD 2) Supply Adjustment of Finished Motor Gasoline (Thousand Barrels) | ||||||||
| Year | Jan | Feb | Mar | Apr | May | Jun | Jul | Aug | Sep | Oct | Nov | Dec |
|---|---|---|---|---|---|---|---|---|---|---|---|---|
| 1986 | 0 | 0 | 0 | 0 | 0 | |||||||
| 1988 | 0 | 0 | ||||||||||
| 1991 | 0 | 0 | 0 | 0 | 0 | 0 | 0 | 0 | 0 | 0 | 0 | 0 |
| 1992 | 0 | 0 | 0 | 0 | 0 | 0 | 0 | 0 | 0 | 0 | 0 | 0 |
| 1993 | 1,512 | 1,828 | 2,737 | 3,183 | 3,140 | 3,003 | 3,135 | 3,334 | 3,261 | 1,600 | 1,862 | 2,789 |
| 1994 | 2,327 | 2,119 | 3,166 | 3,606 | 4,042 | 3,012 | 4,338 | 3,971 | 3,384 | 2,854 | 3,154 | 3,191 |
| 1995 | 2,470 | 3,032 | 4,114 | 3,752 | 5,653 | 4,062 | 2,400 | 4,344 | 3,235 | 4,053 | 3,990 | 3,022 |
| 1996 | 3,513 | 2,734 | 2,985 | 2,961 | 2,552 | 2,339 | 1,613 | 1,934 | 1,235 | 1,730 | 1,475 | 1,123 |
| 1997 | 1,103 | 1,382 | 2,288 | 3,215 | 3,792 | 4,016 | 4,481 | 4,146 | 3,694 | 5,058 | 3,603 | 3,946 |
| 1998 | 2,202 | 1,900 | 2,913 | 2,746 | 4,636 | 3,919 | 3,657 | 4,686 | 4,305 | 3,892 | 2,110 | 3,418 |
| 1999 | 2,691 | 2,332 | 3,969 | 4,294 | 4,893 | 4,757 | 4,817 | 4,256 | 4,972 | 5,806 | 4,890 | 5,495 |
| 2000 | 2,832 | 4,488 | 3,040 | 3,595 | 5,631 | 4,621 | 5,913 | 5,739 | 5,316 | 6,250 | 6,203 | 5,532 |
| 2001 | 6,975 | 5,055 | 5,947 | 6,087 | 6,747 | 5,962 | 6,758 | 6,622 | 6,339 | 6,521 | 6,007 | 5,231 |
| 2002 | 6,915 | 4,999 | 4,875 | 6,052 | 8,107 | 7,184 | 6,107 | 5,225 | 4,912 | 6,084 | 6,092 | 7,047 |
| 2003 | 5,037 | 6,191 | 5,321 | 6,842 | 6,601 | 6,681 | 7,067 | 7,547 | 6,735 | 8,297 | 7,806 | 7,432 |
| 2004 | 7,744 | 8,498 | 9,663 | 9,462 | 10,256 | 11,850 | 10,557 | 10,790 | 9,220 | 9,396 | 10,324 | 9,046 |
| 2005 | 10,341 | 8,217 | 9,578 | 8,753 | 11,455 | 11,290 | 11,924 | 13,355 | 11,712 | 10,387 | 12,024 | 11,239 |
| 2006 | 10,854 | 7,914 | 10,815 | 10,566 | 11,475 | 11,380 | 13,073 | 10,595 | 13,019 | 10,860 | 12,604 | 12,913 |
| 2007 | 10,689 | 10,177 | 11,845 | 12,956 | 10,758 | 11,819 | 11,962 | 12,547 | 12,098 | 13,658 | 15,070 | 15,753 |
| 2008 | 5,631 | 5,393 | 5,829 | 4,683 | 5,617 | 5,188 | 4,580 | 3,357 | 5,361 | 5,652 | 3,397 | 3,382 |
| 2009 | 4,286 | 2,129 | 5,257 | 5,664 | 5,438 | 6,491 | 4,759 | 5,030 | 4,125 | 2,066 | 4,588 | 2,873 |
| 2010 | 3,946 | 3,390 | 3,287 | 4,684 | 4,624 | 2,508 | 1,418 | 2,311 | 1,694 | 840 | 2,520 | 3,238 |
| 2011 | 3,608 | 2,773 | 1,822 | 2,050 | 3,296 | 2,198 | 2,408 | 3,390 | 4,293 | 5,842 | 6,563 | 6,271 |
| 2012 | 1,415 | 7,154 | 5,221 | 6,062 | 9,938 | 8,958 | 5,820 | 8,688 | 4,675 | 6,188 | 3,806 | 3,526 |
| 2013 | 6,097 | 5,702 | 7,937 | 4,670 | 6,187 | 5,212 | 6,439 | 4,556 | -3,003 | -667 | -1,375 | -2,347 |
| 2014 | 4,358 | 2,273 | 2,151 | -2,826 | -989 | 764 | 1,039 | 448 | 813 | 2,626 | 1,483 | 1,710 |
| 2015 | 1,658 | 3,181 | -1,225 | -2,643 | 1,596 | 278 | 2,044 | -1,698 | -175 | -32 | 675 | 1,733 |
| 2016 | -682 | 4,118 | 1,624 | 662 | -1,892 | 2,980 | 1,311 | 917 | 319 | 715 | -1,165 | 3,695 |
| 2017 | 1,986 | 3,521 | 2,596 | 1,893 | 233 | 1,554 | 982 | 4,088 | 1,974 | 3,765 | 3,447 | -2,285 |
| 2018 | 1,840 | 1,773 | 1,730 | -477 | 3,856 | 2,978 | 4,396 | 3,157 | 294 | 124 | 3,210 | 532 |
| 2019 | 3,457 | -94 | 5,067 | 867 | -712 | -572 | 3,833 | 1,045 | 3,424 | 500 | 2,251 | 2,074 |
| 2020 | 4,957 | 2,832 | 1,915 | 3,260 | 5,343 | 2,121 | 2,914 | 2,071 | 744 | 57 | 3,381 | 4,508 |
| 2021 | 544 | 3,388 | 3,854 | -503 | 466 | 1,680 | 3,703 | -112 | 3,141 | 3,142 | 5,150 | 3,764 |
| 2022 | 5,444 | 4,030 | 6,516 | 3,646 | 2,909 | 2,182 | 2,524 | 3,158 | -61 | -871 | 3,504 | 5,902 |
| 2023 | 7,212 | 4,752 | 2,366 | 2,312 | 260 | 2,619 | 2,267 | 5,952 | 2,775 | 7,045 | 3,541 | 4,917 |
| 2024 | 5,749 | |||||||||||
| - = No Data Reported; -- = Not Applicable; NA = Not Available; W = Withheld to avoid disclosure of individual company data. |
| Release Date: 3/29/2024 |
| Next Release Date: 4/30/2024 |