|
Download Data (XLS File) |
|
||||||||
|
||||||||
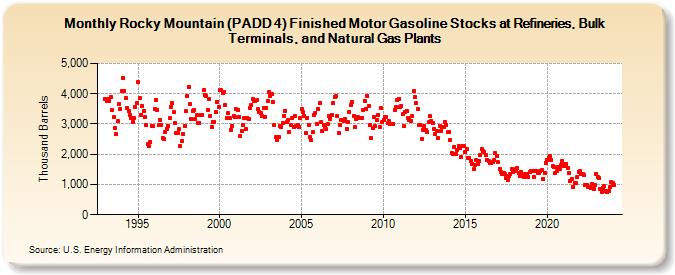
| Rocky Mountain (PADD 4) Finished Motor Gasoline Stocks at Refineries, Bulk Terminals, and Natural Gas Plants (Thousand Barrels) | ||||||||
| Year | Jan | Feb | Mar | Apr | May | Jun | Jul | Aug | Sep | Oct | Nov | Dec |
|---|---|---|---|---|---|---|---|---|---|---|---|---|
| 1993 | 3,834 | 3,756 | 3,814 | 3,762 | 3,892 | 3,451 | 3,231 | 2,861 | 2,665 | 3,098 | 3,675 | 3,500 |
| 1994 | 4,074 | 4,525 | 4,092 | 3,873 | 3,533 | 3,443 | 3,297 | 3,186 | 3,059 | 3,195 | 3,554 | 3,696 |
| 1995 | 4,390 | 3,872 | 3,311 | 3,608 | 3,426 | 3,215 | 2,976 | 2,322 | 2,261 | 2,400 | 2,948 | 2,919 |
| 1996 | 3,505 | 3,806 | 3,475 | 2,956 | 3,122 | 2,976 | 2,528 | 2,492 | 2,729 | 2,847 | 2,936 | 3,186 |
| 1997 | 3,575 | 3,700 | 3,394 | 3,037 | 2,717 | 2,702 | 2,826 | 2,270 | 2,438 | 2,661 | 2,935 | 3,419 |
| 1998 | 3,929 | 4,225 | 3,654 | 3,172 | 3,440 | 3,472 | 3,173 | 3,283 | 3,028 | 3,039 | 3,311 | 3,306 |
| 1999 | 4,121 | 3,972 | 3,913 | 3,476 | 3,831 | 3,277 | 2,909 | 3,065 | 3,075 | 3,391 | 3,738 | 3,563 |
| 2000 | 4,125 | 4,111 | 4,011 | 4,062 | 3,626 | 3,208 | 3,364 | 3,200 | 2,815 | 2,946 | 3,278 | 3,225 |
| 2001 | 3,485 | 3,470 | 3,239 | 2,614 | 2,764 | 2,959 | 3,199 | 2,820 | 3,194 | 3,160 | 3,533 | 3,618 |
| 2002 | 3,821 | 3,766 | 3,764 | 3,798 | 3,503 | 3,406 | 3,378 | 3,264 | 3,530 | 3,240 | 3,532 | 3,775 |
| 2003 | 4,058 | 3,939 | 3,978 | 3,730 | 2,974 | 2,561 | 2,474 | 2,583 | 2,917 | 2,908 | 3,016 | 3,277 |
| 2004 | 3,445 | 3,049 | 3,121 | 2,751 | 2,982 | 3,191 | 2,893 | 3,266 | 2,949 | 2,974 | 2,913 | 3,192 |
| 2005 | 3,508 | 3,384 | 3,275 | 2,706 | 3,214 | 2,976 | 2,567 | 2,456 | 2,726 | 3,294 | 3,373 | 3,015 |
| 2006 | 3,489 | 3,678 | 3,053 | 2,754 | 2,952 | 2,898 | 2,842 | 2,989 | 3,255 | 3,165 | 3,309 | 3,699 |
| 2007 | 3,877 | 3,911 | 3,277 | 2,714 | 2,981 | 3,131 | 3,126 | 3,104 | 3,148 | 2,850 | 3,051 | 3,402 |
| 2008 | 3,641 | 3,726 | 3,272 | 2,890 | 3,157 | 3,221 | 3,203 | 3,206 | 3,206 | 3,451 | 3,773 | 3,504 |
| 2009 | 3,931 | 3,598 | 2,952 | 2,540 | 2,872 | 3,244 | 2,917 | 3,133 | 3,281 | 2,896 | 3,533 | 3,071 |
| 2010 | 3,144 | 3,229 | 3,239 | 3,027 | 3,107 | 2,995 | 2,995 | 3,010 | 3,476 | 3,562 | 3,797 | 3,834 |
| 2011 | 3,561 | 3,600 | 3,321 | 2,938 | 3,411 | 3,433 | 3,212 | 3,128 | 3,082 | 3,278 | 4,087 | 3,881 |
| 2012 | 3,679 | 3,491 | 2,967 | 2,953 | 2,515 | 2,805 | 2,921 | 2,788 | 2,750 | 3,054 | 3,253 | 3,099 |
| 2013 | 3,043 | 2,839 | 2,660 | 2,752 | 2,524 | 2,944 | 2,771 | 2,892 | 2,906 | 3,074 | 2,972 | 2,725 |
| 2014 | 2,722 | 2,462 | 2,041 | 1,993 | 2,232 | 2,017 | 2,148 | 2,267 | 2,190 | 1,901 | 2,288 | 2,258 |
| 2015 | 2,085 | 2,164 | 1,862 | 1,889 | 1,769 | 1,692 | 1,499 | 1,653 | 1,794 | 1,680 | 1,763 | 1,958 |
| 2016 | 2,169 | 2,101 | 2,066 | 1,958 | 1,797 | 1,785 | 1,706 | 1,722 | 1,731 | 1,797 | 2,031 | 1,941 |
| 2017 | 1,731 | 1,527 | 1,412 | 1,349 | 1,381 | 1,348 | 1,209 | 1,144 | 1,265 | 1,345 | 1,505 | 1,405 |
| 2018 | 1,434 | 1,523 | 1,528 | 1,384 | 1,264 | 1,419 | 1,300 | 1,258 | 1,344 | 1,360 | 1,260 | 1,400 |
| 2019 | 1,449 | 1,446 | 1,232 | 1,459 | 1,435 | 1,384 | 1,368 | 1,461 | 1,464 | 1,184 | 1,390 | 1,707 |
| 2020 | 1,797 | 1,885 | 1,936 | 1,797 | 1,602 | 1,574 | 1,378 | 1,435 | 1,590 | 1,522 | 1,640 | 1,789 |
| 2021 | 1,600 | 1,687 | 1,683 | 1,548 | 1,376 | 1,123 | 1,185 | 920 | 1,050 | 1,037 | 1,239 | 1,413 |
| 2022 | 1,453 | 1,334 | 1,355 | 1,300 | 992 | 985 | 924 | 909 | 872 | 1,019 | 839 | 978 |
| 2023 | 1,356 | 1,258 | 1,201 | 841 | 766 | 888 | 942 | 776 | 744 | 782 | 925 | 1,068 |
| 2024 | 1,041 | |||||||||||
| - = No Data Reported; -- = Not Applicable; NA = Not Available; W = Withheld to avoid disclosure of individual company data. |
| Release Date: 3/29/2024 |
| Next Release Date: 4/30/2024 |