|
Download Data (XLS File) |
|
||||||||
|
||||||||
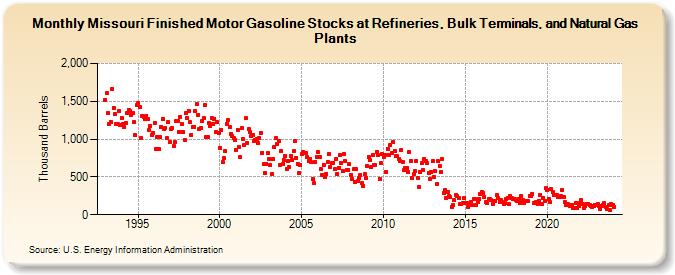
| Missouri Finished Motor Gasoline Stocks at Refineries, Bulk Terminals, and Natural Gas Plants (Thousand Barrels) | ||||||||
| Year | Jan | Feb | Mar | Apr | May | Jun | Jul | Aug | Sep | Oct | Nov | Dec |
|---|---|---|---|---|---|---|---|---|---|---|---|---|
| 1993 | 1,515 | 1,606 | 1,343 | 1,203 | 1,228 | 1,668 | 1,417 | 1,327 | 1,197 | 1,206 | 1,371 | 1,184 |
| 1994 | 1,280 | 1,201 | 1,159 | 1,217 | 1,345 | 1,382 | 1,373 | 1,319 | 1,349 | 1,229 | 1,051 | 1,445 |
| 1995 | 1,479 | 1,425 | 1,018 | 1,312 | 1,296 | 1,264 | 1,310 | 1,260 | 1,126 | 1,176 | 1,055 | 1,082 |
| 1996 | 1,215 | 868 | 1,033 | 866 | 1,031 | 1,166 | 1,264 | 1,132 | 1,147 | 1,017 | 1,221 | 960 |
| 1997 | 1,127 | 1,148 | 903 | 960 | 1,235 | 1,237 | 1,097 | 1,294 | 1,199 | 1,096 | 989 | 1,339 |
| 1998 | 1,284 | 1,377 | 1,222 | 1,060 | 1,161 | 1,162 | 1,372 | 1,460 | 1,325 | 1,137 | 1,151 | 1,236 |
| 1999 | 1,273 | 1,450 | 1,032 | 1,025 | 1,213 | 1,174 | 1,277 | 1,205 | 1,268 | 1,099 | 1,221 | 1,082 |
| 2000 | 888 | 1,123 | 697 | 750 | 841 | 1,200 | 1,248 | 1,158 | 1,071 | 1,041 | 1,011 | 992 |
| 2001 | 859 | 1,126 | 901 | 763 | 1,149 | 998 | 924 | 1,274 | 950 | 1,132 | 1,090 | 1,038 |
| 2002 | 1,052 | 971 | 984 | 1,004 | 945 | 1,012 | 1,084 | 822 | 665 | 549 | 675 | 812 |
| 2003 | 738 | 654 | 545 | 731 | 890 | 1,013 | 941 | 981 | 662 | 844 | 667 | 721 |
| 2004 | 781 | 608 | 711 | 629 | 780 | 719 | 840 | 972 | 754 | 675 | 549 | 662 |
| 2005 | 801 | 829 | 814 | 819 | 764 | 706 | 740 | 695 | 467 | 414 | 698 | 767 |
| 2006 | 823 | 768 | 603 | 527 | 663 | 502 | 544 | 696 | 808 | 632 | 680 | 686 |
| 2007 | 602 | 739 | 538 | 622 | 796 | 684 | 584 | 800 | 708 | 597 | 595 | 667 |
| 2008 | 531 | 477 | 601 | 437 | 603 | 448 | 482 | 531 | 413 | 381 | 533 | 491 |
| 2009 | 647 | 764 | 718 | 632 | 792 | 656 | 656 | 833 | 794 | 476 | 679 | 798 |
| 2010 | 757 | 790 | 563 | 874 | 793 | 919 | 816 | 965 | 843 | 771 | 771 | 743 |
| 2011 | 705 | 856 | 698 | 585 | 621 | 617 | 565 | 825 | 710 | 480 | 532 | 579 |
| 2012 | 715 | 489 | 372 | 568 | 678 | 590 | 736 | 710 | 680 | 555 | 476 | 567 |
| 2013 | 705 | 499 | 574 | 411 | 705 | 650 | 562 | 735 | 289 | 325 | 222 | 300 |
| 2014 | 246 | 234 | 108 | 126 | 191 | 255 | 243 | 220 | 144 | 145 | 152 | 215 |
| 2015 | 152 | 158 | 108 | 129 | 169 | 128 | 207 | 206 | 133 | 174 | 207 | 277 |
| 2016 | 303 | 285 | 240 | 162 | 154 | 207 | 205 | 194 | 148 | 179 | 184 | 261 |
| 2017 | 224 | 174 | 190 | 171 | 144 | 153 | 205 | 225 | 136 | 247 | 219 | 202 |
| 2018 | 204 | 189 | 182 | 205 | 158 | 249 | 188 | 153 | 178 | 178 | 178 | 248 |
| 2019 | 248 | 277 | 155 | 155 | 165 | 146 | 185 | 263 | 147 | 223 | 187 | 349 |
| 2020 | 332 | 206 | 163 | 337 | 299 | 260 | 257 | 255 | 230 | 237 | 250 | 330 |
| 2021 | 228 | 167 | 133 | 142 | 122 | 109 | 130 | 89 | 93 | 159 | 92 | 115 |
| 2022 | 160 | 190 | 139 | 87 | 115 | 146 | 148 | 135 | 115 | 105 | 116 | 128 |
| 2023 | 122 | 140 | 110 | 76 | 113 | 126 | 152 | 101 | 75 | 123 | 62 | 139 |
| 2024 | 133 | |||||||||||
| - = No Data Reported; -- = Not Applicable; NA = Not Available; W = Withheld to avoid disclosure of individual company data. |
| Release Date: 3/29/2024 |
| Next Release Date: 4/30/2024 |