|
Download Data (XLS File) |
|
||||||||
|
||||||||
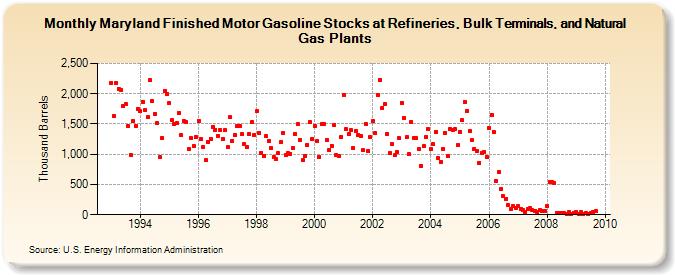
| Maryland Finished Motor Gasoline Stocks at Refineries, Bulk Terminals, and Natural Gas Plants (Thousand Barrels) | ||||||||
| Year | Jan | Feb | Mar | Apr | May | Jun | Jul | Aug | Sep | Oct | Nov | Dec |
|---|---|---|---|---|---|---|---|---|---|---|---|---|
| 1993 | 2,179 | 1,634 | 2,174 | 2,085 | 2,069 | 1,794 | 1,824 | 1,459 | 991 | 1,543 | 1,464 | 1,746 |
| 1994 | 1,708 | 1,868 | 1,730 | 1,612 | 2,223 | 1,878 | 1,670 | 1,516 | 946 | 1,273 | 2,046 | 1,996 |
| 1995 | 1,843 | 1,561 | 1,494 | 1,516 | 1,687 | 1,313 | 1,553 | 1,529 | 1,084 | 1,266 | 1,139 | 1,281 |
| 1996 | 1,555 | 1,249 | 1,127 | 908 | 1,209 | 1,256 | 1,453 | 1,408 | 1,306 | 1,397 | 1,254 | 1,395 |
| 1997 | 1,123 | 1,610 | 1,221 | 1,320 | 1,460 | 1,474 | 1,330 | 1,164 | 1,115 | 1,338 | 1,525 | 1,322 |
| 1998 | 1,709 | 1,357 | 1,022 | 978 | 1,294 | 1,222 | 1,100 | 950 | 914 | 1,012 | 1,199 | 1,353 |
| 1999 | 983 | 1,023 | 1,010 | 1,103 | 1,337 | 1,493 | 1,236 | 907 | 972 | 1,159 | 1,535 | 1,253 |
| 2000 | 1,463 | 1,215 | 955 | 1,493 | 1,493 | 1,234 | 1,073 | 1,142 | 1,478 | 991 | 975 | 1,288 |
| 2001 | 1,977 | 1,409 | 1,332 | 1,393 | 1,096 | 1,383 | 1,318 | 1,300 | 1,067 | 1,499 | 1,058 | 1,282 |
| 2002 | 1,550 | 1,344 | 1,979 | 2,233 | 1,767 | 1,829 | 1,341 | 1,014 | 1,167 | 979 | 1,029 | 1,261 |
| 2003 | 1,847 | 1,604 | 1,277 | 998 | 1,531 | 1,266 | 1,264 | 1,084 | 804 | 1,135 | 1,281 | 1,412 |
| 2004 | 1,083 | 1,163 | 1,364 | 937 | 877 | 1,090 | 1,359 | 966 | 1,425 | 1,398 | 1,411 | 1,150 |
| 2005 | 1,374 | 1,565 | 1,871 | 1,721 | 1,380 | 1,228 | 1,088 | 1,055 | 855 | 1,020 | 1,033 | 948 |
| 2006 | 1,435 | 1,655 | 1,373 | 558 | 705 | 425 | 302 | 264 | 164 | 97 | 136 | 109 |
| 2007 | 137 | 92 | 80 | 52 | 101 | 105 | 76 | 68 | 46 | 73 | 63 | 67 |
| 2008 | 140 | 540 | 542 | 521 | 34 | 32 | 25 | 22 | 7 | 44 | 14 | 31 |
| 2009 | 45 | 9 | 37 | 7 | 33 | 17 | 27 | 41 | 60 | |||
| - = No Data Reported; -- = Not Applicable; NA = Not Available; W = Withheld to avoid disclosure of individual company data. |
| Release Date: 3/29/2024 |
| Next Release Date: 4/30/2024 |