|
Download Data (XLS File) |
|
||||||||
|
||||||||
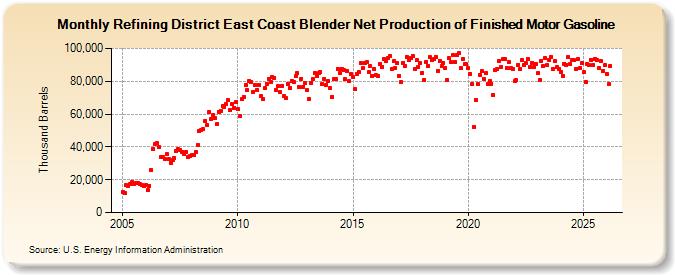
| Refining District East Coast Blender Net Production of Finished Motor Gasoline (Thousand Barrels) | ||||||||
| Year | Jan | Feb | Mar | Apr | May | Jun | Jul | Aug | Sep | Oct | Nov | Dec |
|---|---|---|---|---|---|---|---|---|---|---|---|---|
| 2005 | 12,673 | 12,189 | 16,704 | 16,326 | 17,342 | 18,836 | 17,659 | 18,271 | 18,186 | 17,432 | 17,078 | 16,477 |
| 2006 | 16,670 | 13,594 | 16,344 | 25,867 | 38,879 | 41,912 | 42,246 | 39,726 | 34,030 | 33,634 | 32,649 | 35,583 |
| 2007 | 32,508 | 30,405 | 32,268 | 33,323 | 37,511 | 38,464 | 38,203 | 37,069 | 35,559 | 37,009 | 33,695 | 34,185 |
| 2008 | 34,795 | 34,951 | 36,730 | 41,011 | 49,824 | 50,389 | 50,762 | 55,820 | 53,238 | 61,317 | 57,257 | 59,703 |
| 2009 | 57,356 | 53,689 | 61,457 | 61,776 | 64,820 | 64,577 | 66,195 | 68,355 | 62,277 | 66,314 | 63,850 | 67,223 |
| 2010 | 63,017 | 58,807 | 68,938 | 70,519 | 77,804 | 74,749 | 80,364 | 79,774 | 73,717 | 77,995 | 74,707 | 77,792 |
| 2011 | 70,974 | 68,920 | 75,845 | 78,306 | 81,464 | 79,737 | 82,596 | 82,140 | 74,683 | 77,042 | 73,323 | 77,245 |
| 2012 | 70,877 | 69,625 | 78,576 | 75,569 | 80,307 | 79,383 | 83,176 | 85,040 | 76,559 | 81,638 | 76,774 | 78,969 |
| 2013 | 74,567 | 69,462 | 79,102 | 81,402 | 84,918 | 82,950 | 84,972 | 85,604 | 78,311 | 81,655 | 78,001 | 80,110 |
| 2014 | 75,867 | 70,543 | 81,111 | 81,218 | 87,604 | 85,032 | 87,682 | 87,045 | 81,085 | 86,169 | 80,256 | 84,344 |
| 2015 | 82,478 | 75,101 | 84,552 | 85,652 | 90,957 | 88,050 | 91,215 | 91,521 | 85,460 | 89,094 | 83,444 | 87,488 |
| 2016 | 83,681 | 83,238 | 90,555 | 88,844 | 93,432 | 92,330 | 94,148 | 95,453 | 87,670 | 92,111 | 88,018 | 91,074 |
| 2017 | 83,420 | 79,521 | 91,027 | 89,178 | 94,887 | 92,885 | 94,083 | 95,590 | 87,370 | 92,742 | 88,955 | 90,914 |
| 2018 | 85,240 | 80,794 | 91,948 | 89,469 | 94,579 | 92,773 | 93,273 | 95,053 | 86,454 | 92,412 | 89,327 | 91,396 |
| 2019 | 88,279 | 80,596 | 93,892 | 91,517 | 95,888 | 91,758 | 95,735 | 96,914 | 87,751 | 93,446 | 90,402 | 90,221 |
| 2020 | 87,802 | 84,679 | 78,074 | 52,392 | 68,337 | 78,434 | 83,910 | 85,993 | 81,507 | 84,778 | 78,152 | 80,061 |
| 2021 | 78,510 | 71,722 | 86,795 | 87,478 | 92,025 | 88,802 | 93,353 | 93,419 | 88,241 | 91,421 | 87,931 | 87,718 |
| 2022 | 79,833 | 80,673 | 90,168 | 87,515 | 93,040 | 89,917 | 90,856 | 93,394 | 88,697 | 91,384 | 88,475 | 90,689 |
| 2023 | 84,766 | 80,549 | 92,320 | 89,531 | 94,172 | 89,831 | 92,942 | 94,837 | 87,742 | 92,442 | 88,600 | 87,585 |
| 2024 | 85,745 | 83,430 | 90,633 | 90,034 | 94,803 | 90,195 | ||||||
| - = No Data Reported; -- = Not Applicable; NA = Not Available; W = Withheld to avoid disclosure of individual company data. |
| Release Date: 8/30/2024 |
| Next Release Date: 9/30/2024 |