|
Download Data (XLS File) |
|
||||||||
|
||||||||
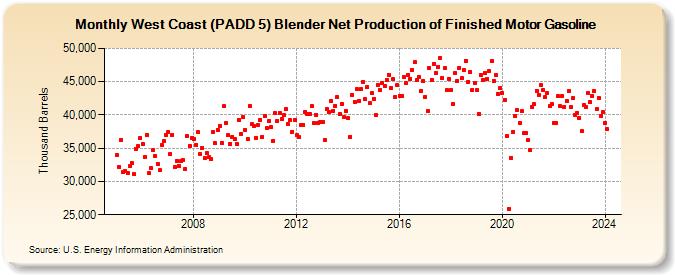
| West Coast (PADD 5) Blender Net Production of Finished Motor Gasoline (Thousand Barrels) | ||||||||
| Year | Jan | Feb | Mar | Apr | May | Jun | Jul | Aug | Sep | Oct | Nov | Dec |
|---|---|---|---|---|---|---|---|---|---|---|---|---|
| 2005 | 34,014 | 32,220 | 36,248 | 31,377 | 31,572 | 31,213 | 32,286 | 32,748 | 31,062 | 34,923 | 35,261 | 36,557 |
| 2006 | 35,627 | 33,669 | 36,977 | 31,214 | 32,024 | 34,669 | 33,836 | 32,681 | 31,680 | 35,514 | 36,012 | 37,028 |
| 2007 | 37,457 | 34,063 | 37,042 | 32,108 | 33,080 | 32,309 | 33,009 | 33,217 | 31,836 | 36,764 | 35,398 | 36,537 |
| 2008 | 36,351 | 35,530 | 37,380 | 34,068 | 35,052 | 33,453 | 34,246 | 33,654 | 33,340 | 37,464 | 35,736 | 37,791 |
| 2009 | 38,345 | 35,808 | 41,267 | 38,795 | 36,940 | 35,620 | 36,710 | 36,378 | 35,632 | 39,243 | 37,179 | 39,638 |
| 2010 | 37,756 | 36,359 | 41,306 | 38,578 | 38,365 | 36,556 | 38,518 | 39,251 | 36,752 | 39,853 | 38,040 | 39,151 |
| 2011 | 38,179 | 36,142 | 40,295 | 39,097 | 40,264 | 39,402 | 39,916 | 40,847 | 38,642 | 39,224 | 37,502 | 39,188 |
| 2012 | 36,938 | 36,633 | 38,557 | 38,544 | 40,459 | 40,106 | 40,201 | 41,278 | 38,815 | 40,028 | 38,759 | 38,958 |
| 2013 | 38,966 | 36,251 | 40,847 | 40,435 | 42,135 | 40,619 | 41,415 | 42,733 | 40,105 | 41,664 | 39,630 | 40,603 |
| 2014 | 39,486 | 36,737 | 43,039 | 41,990 | 43,834 | 42,124 | 43,845 | 45,014 | 42,351 | 44,163 | 41,731 | 43,254 |
| 2015 | 42,444 | 39,919 | 44,566 | 43,758 | 44,812 | 44,363 | 45,296 | 46,062 | 44,109 | 45,337 | 42,670 | 44,444 |
| 2016 | 42,844 | 42,913 | 45,704 | 44,755 | 46,069 | 45,439 | 46,720 | 47,907 | 45,207 | 45,740 | 43,611 | 45,076 |
| 2017 | 42,715 | 40,622 | 47,061 | 45,292 | 47,724 | 46,331 | 47,251 | 48,573 | 45,564 | 47,018 | 43,678 | 45,466 |
| 2018 | 43,673 | 41,661 | 46,336 | 45,113 | 47,124 | 45,504 | 46,798 | 48,156 | 44,989 | 46,478 | 43,806 | 44,853 |
| 2019 | 43,711 | 40,196 | 45,985 | 45,294 | 46,293 | 45,401 | 46,583 | 48,075 | 45,144 | 46,026 | 43,148 | 44,029 |
| 2020 | 43,314 | 42,296 | 36,810 | 25,909 | 33,572 | 37,458 | 39,882 | 40,687 | 38,787 | 40,524 | 37,229 | 37,269 |
| 2021 | 36,166 | 34,724 | 41,265 | 41,572 | 43,634 | 43,032 | 44,461 | 43,689 | 42,629 | 43,307 | 41,305 | 41,664 |
| 2022 | 38,853 | 38,765 | 42,795 | 41,300 | 42,816 | 41,159 | 42,061 | 43,624 | 41,256 | 42,512 | 40,002 | 40,299 |
| 2023 | 39,547 | 37,544 | 41,438 | 41,215 | 43,300 | 41,931 | 42,898 | 43,643 | 40,963 | 42,555 | 39,896 | 40,434 |
| 2024 | 38,821 | 37,846 | 41,437 | 40,663 | 42,940 | 41,411 | ||||||
| - = No Data Reported; -- = Not Applicable; NA = Not Available; W = Withheld to avoid disclosure of individual company data. |
| Release Date: 8/30/2024 |
| Next Release Date: 9/30/2024 |