|
Download Data (XLS File) |
|
||||||||
|
||||||||
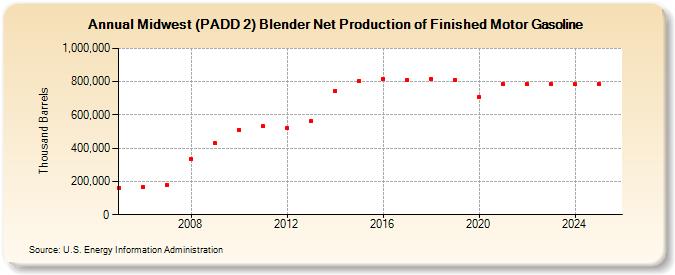
| Midwest (PADD 2) Blender Net Production of Finished Motor Gasoline (Thousand Barrels) | ||||||||
| Decade | Year-0 | Year-1 | Year-2 | Year-3 | Year-4 | Year-5 | Year-6 | Year-7 | Year-8 | Year-9 |
|---|---|---|---|---|---|---|---|---|---|---|
| 2000's | 161,482 | 164,400 | 180,082 | 336,034 | 428,272 | |||||
| 2010's | 512,267 | 530,955 | 521,892 | 563,109 | 745,640 | 806,123 | 818,030 | 812,913 | 816,428 | 811,616 |
| 2020's | 708,420 | 785,081 | 784,188 | 784,730 |
| - = No Data Reported; -- = Not Applicable; NA = Not Available; W = Withheld to avoid disclosure of individual company data. |
| Release Date: 3/29/2024 |
| Next Release Date: 8/30/2024 |