|
Download Data (XLS File) |
|
||||||||
|
||||||||
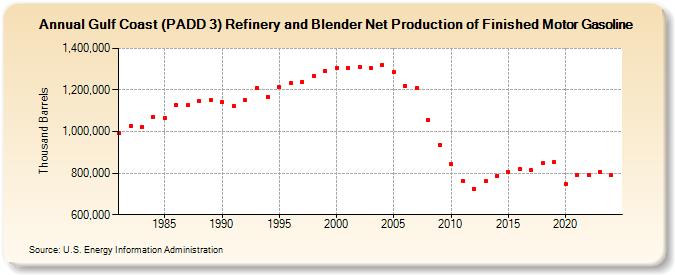
| Gulf Coast (PADD 3) Refinery and Blender Net Production of Finished Motor Gasoline (Thousand Barrels) | ||||||||
| Decade | Year-0 | Year-1 | Year-2 | Year-3 | Year-4 | Year-5 | Year-6 | Year-7 | Year-8 | Year-9 |
|---|---|---|---|---|---|---|---|---|---|---|
| 1980's | 992,240 | 1,026,816 | 1,023,909 | 1,070,481 | 1,065,959 | 1,127,220 | 1,128,212 | 1,144,791 | 1,154,004 | |
| 1990's | 1,140,568 | 1,123,288 | 1,149,859 | 1,208,397 | 1,168,238 | 1,214,003 | 1,234,953 | 1,239,925 | 1,269,535 | 1,291,031 |
| 2000's | 1,306,457 | 1,306,448 | 1,311,721 | 1,307,805 | 1,321,914 | 1,286,768 | 1,218,029 | 1,211,365 | 1,057,734 | 935,816 |
| 2010's | 843,854 | 761,354 | 725,997 | 760,291 | 786,314 | 806,365 | 819,879 | 813,269 | 849,460 | 853,580 |
| 2020's | 748,650 | 790,122 | 792,645 | 806,271 |
| - = No Data Reported; -- = Not Applicable; NA = Not Available; W = Withheld to avoid disclosure of individual company data. |
| Release Date: 3/29/2024 |
| Next Release Date: 8/30/2024 |