|
Download Data (XLS File) |
|
||||||||
|
||||||||
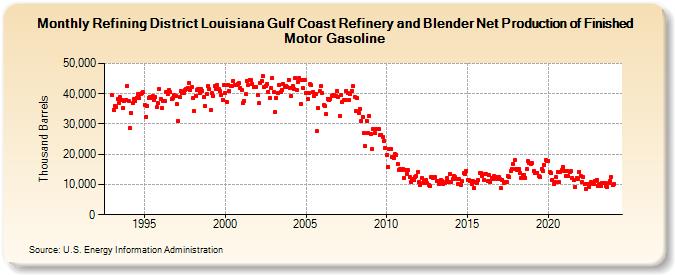
| Refining District Louisiana Gulf Coast Refinery and Blender Net Production of Finished Motor Gasoline (Thousand Barrels) | ||||||||
| Year | Jan | Feb | Mar | Apr | May | Jun | Jul | Aug | Sep | Oct | Nov | Dec |
|---|---|---|---|---|---|---|---|---|---|---|---|---|
| 1993 | 39,440 | 34,755 | 36,085 | 35,581 | 38,220 | 36,975 | 38,816 | 37,851 | 35,388 | 37,515 | 37,874 | 42,576 |
| 1994 | 37,735 | 28,638 | 33,591 | 36,850 | 38,354 | 37,627 | 38,671 | 39,853 | 38,489 | 39,877 | 40,083 | 40,438 |
| 1995 | 36,295 | 32,368 | 36,106 | 38,602 | 39,047 | 38,565 | 39,235 | 37,782 | 38,863 | 35,463 | 36,845 | 41,568 |
| 1996 | 38,415 | 35,188 | 37,569 | 37,632 | 40,591 | 39,876 | 41,212 | 40,444 | 38,233 | 38,539 | 39,462 | 39,227 |
| 1997 | 36,500 | 30,917 | 38,878 | 40,898 | 40,150 | 40,127 | 41,132 | 41,460 | 42,049 | 43,655 | 41,261 | 42,170 |
| 1998 | 38,485 | 34,260 | 39,376 | 41,256 | 41,513 | 40,161 | 41,409 | 40,964 | 38,766 | 35,865 | 40,046 | 42,462 |
| 1999 | 41,441 | 34,489 | 40,107 | 39,127 | 42,456 | 41,579 | 42,728 | 41,464 | 40,863 | 39,488 | 38,071 | 42,997 |
| 2000 | 40,205 | 37,293 | 42,913 | 40,908 | 42,684 | 42,432 | 44,246 | 42,933 | 42,862 | 43,179 | 43,386 | 41,983 |
| 2001 | 41,117 | 36,850 | 37,751 | 39,874 | 44,325 | 42,737 | 44,541 | 44,380 | 43,357 | 42,064 | 42,384 | 42,269 |
| 2002 | 39,613 | 36,784 | 43,624 | 44,320 | 45,720 | 42,166 | 42,479 | 43,244 | 40,503 | 38,713 | 41,933 | 45,234 |
| 2003 | 40,441 | 33,913 | 38,542 | 40,349 | 43,049 | 40,699 | 41,287 | 43,333 | 42,388 | 42,600 | 42,292 | 44,629 |
| 2004 | 41,884 | 39,186 | 42,479 | 41,526 | 45,294 | 41,294 | 44,001 | 45,133 | 36,651 | 44,693 | 41,788 | 44,427 |
| 2005 | 40,386 | 38,109 | 40,362 | 43,126 | 42,757 | 40,722 | 39,409 | 39,986 | 27,602 | 35,201 | 40,767 | 42,532 |
| 2006 | 40,301 | 36,226 | 36,016 | 33,309 | 38,400 | 37,781 | 38,362 | 39,383 | 39,479 | 39,682 | 39,379 | 40,822 |
| 2007 | 38,958 | 32,713 | 39,453 | 37,348 | 37,829 | 38,034 | 40,995 | 40,149 | 37,997 | 39,931 | 41,013 | 42,407 |
| 2008 | 39,015 | 34,149 | 38,552 | 33,724 | 34,971 | 30,911 | 32,400 | 27,115 | 22,567 | 31,099 | 27,163 | 32,781 |
| 2009 | 26,642 | 21,747 | 28,215 | 27,154 | 28,204 | 28,278 | 28,283 | 26,223 | 26,495 | 25,810 | 24,407 | 22,198 |
| 2010 | 19,743 | 15,900 | 21,719 | 21,805 | 19,099 | 18,622 | 20,153 | 19,751 | 16,813 | 14,734 | 15,250 | 14,739 |
| 2011 | 15,235 | 12,068 | 14,909 | 13,617 | 14,683 | 12,435 | 10,725 | 11,652 | 11,445 | 12,507 | 12,958 | 14,083 |
| 2012 | 10,855 | 9,943 | 12,251 | 10,612 | 11,215 | 11,323 | 10,360 | 9,844 | 9,406 | 12,586 | 12,192 | 12,520 |
| 2013 | 12,452 | 11,298 | 11,279 | 10,080 | 11,414 | 11,196 | 10,178 | 10,340 | 10,875 | 12,111 | 10,954 | 13,388 |
| 2014 | 10,854 | 11,747 | 12,755 | 12,343 | 11,953 | 10,256 | 11,667 | 9,904 | 11,049 | 13,671 | 13,463 | 14,477 |
| 2015 | 11,454 | 11,415 | 11,307 | 10,151 | 11,078 | 8,797 | 10,801 | 10,522 | 11,495 | 13,682 | 13,876 | 12,635 |
| 2016 | 11,639 | 13,387 | 13,407 | 11,028 | 12,974 | 10,756 | 12,037 | 11,872 | 12,654 | 12,535 | 11,678 | 12,591 |
| 2017 | 11,657 | 8,748 | 11,637 | 10,580 | 10,972 | 10,843 | 12,788 | 12,522 | 14,306 | 15,137 | 16,782 | 18,010 |
| 2018 | 15,088 | 14,734 | 15,279 | 13,922 | 12,266 | 13,245 | 13,142 | 12,246 | 15,032 | 17,797 | 17,066 | 16,898 |
| 2019 | 17,040 | 14,489 | 13,933 | 13,715 | 13,901 | 12,954 | 12,511 | 15,138 | 14,514 | 16,573 | 18,008 | 17,781 |
| 2020 | 17,899 | 14,153 | 13,778 | 11,456 | 10,134 | 10,874 | 12,392 | 13,970 | 10,879 | 14,230 | 14,734 | 15,735 |
| 2021 | 14,348 | 12,921 | 14,595 | 12,719 | 14,003 | 14,313 | 12,138 | 11,452 | 9,189 | 12,191 | 11,967 | 14,239 |
| 2022 | 12,960 | 10,689 | 12,482 | 9,990 | 8,536 | 10,226 | 9,030 | 10,176 | 10,797 | 10,567 | 10,273 | 11,026 |
| 2023 | 11,575 | 9,644 | 10,238 | 9,590 | 10,562 | 10,325 | 10,462 | 9,466 | 9,149 | 10,431 | 11,188 | 12,366 |
| 2024 | 9,787 | |||||||||||
| - = No Data Reported; -- = Not Applicable; NA = Not Available; W = Withheld to avoid disclosure of individual company data. |
| Release Date: 3/29/2024 |
| Next Release Date: 4/30/2024 |