|
Download Data (XLS File) |
|
||||||||
|
||||||||
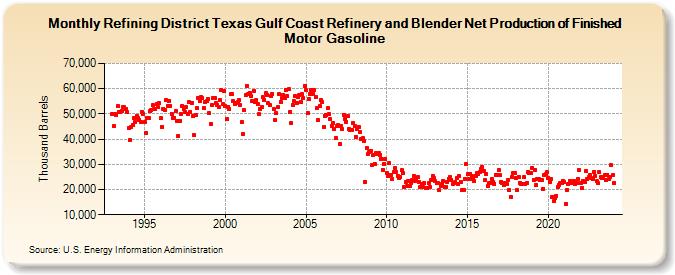
| Refining District Texas Gulf Coast Refinery and Blender Net Production of Finished Motor Gasoline (Thousand Barrels) | ||||||||
| Year | Jan | Feb | Mar | Apr | May | Jun | Jul | Aug | Sep | Oct | Nov | Dec |
|---|---|---|---|---|---|---|---|---|---|---|---|---|
| 1993 | 49,953 | 45,116 | 49,971 | 49,679 | 52,961 | 50,686 | 50,640 | 51,166 | 52,619 | 52,584 | 51,903 | 50,771 |
| 1994 | 44,377 | 39,606 | 44,790 | 45,700 | 48,503 | 46,720 | 49,332 | 48,464 | 47,766 | 46,800 | 50,864 | 50,020 |
| 1995 | 46,977 | 42,280 | 48,246 | 48,236 | 50,999 | 51,402 | 53,419 | 51,940 | 52,003 | 53,919 | 52,575 | 54,174 |
| 1996 | 48,230 | 44,938 | 52,125 | 51,700 | 55,427 | 53,077 | 55,182 | 53,204 | 50,127 | 48,538 | 48,518 | 51,126 |
| 1997 | 47,344 | 41,368 | 47,355 | 50,107 | 53,148 | 51,801 | 50,762 | 52,573 | 50,093 | 54,718 | 50,611 | 54,335 |
| 1998 | 49,059 | 41,601 | 49,748 | 52,440 | 56,131 | 55,114 | 56,682 | 56,282 | 52,335 | 54,832 | 54,943 | 56,001 |
| 1999 | 50,199 | 45,922 | 53,505 | 56,417 | 56,326 | 54,511 | 53,640 | 52,700 | 55,586 | 59,536 | 53,915 | 58,978 |
| 2000 | 53,050 | 47,799 | 52,930 | 51,803 | 57,778 | 57,818 | 55,032 | 53,910 | 54,420 | 54,636 | 55,357 | 53,503 |
| 2001 | 46,809 | 41,825 | 51,513 | 57,383 | 61,186 | 57,822 | 58,418 | 56,961 | 55,188 | 59,242 | 54,773 | 55,389 |
| 2002 | 53,845 | 49,805 | 52,102 | 52,886 | 56,558 | 55,568 | 58,236 | 57,621 | 54,220 | 53,361 | 56,995 | 58,077 |
| 2003 | 51,892 | 47,542 | 50,250 | 52,622 | 57,778 | 54,784 | 56,394 | 57,554 | 56,164 | 59,457 | 57,057 | 59,763 |
| 2004 | 50,909 | 46,443 | 53,681 | 54,928 | 56,966 | 54,377 | 56,743 | 57,393 | 54,908 | 57,750 | 56,217 | 61,224 |
| 2005 | 59,431 | 50,314 | 55,937 | 57,950 | 59,591 | 58,058 | 59,420 | 56,545 | 52,351 | 47,740 | 53,008 | 55,464 |
| 2006 | 54,539 | 44,979 | 49,161 | 49,388 | 52,190 | 49,919 | 47,951 | 45,348 | 46,342 | 44,073 | 40,499 | 45,024 |
| 2007 | 45,472 | 38,242 | 45,157 | 43,999 | 49,594 | 47,925 | 46,830 | 49,047 | 43,940 | 43,741 | 43,801 | 46,365 |
| 2008 | 45,032 | 40,960 | 43,936 | 44,740 | 42,997 | 39,899 | 40,321 | 39,441 | 23,082 | 36,493 | 34,092 | 34,991 |
| 2009 | 35,305 | 29,911 | 33,726 | 30,210 | 34,677 | 34,150 | 34,660 | 33,849 | 32,232 | 27,859 | 30,148 | 31,935 |
| 2010 | 26,703 | 25,217 | 30,449 | 25,847 | 24,290 | 26,754 | 28,501 | 26,902 | 25,525 | 24,632 | 24,940 | 27,581 |
| 2011 | 26,466 | 21,175 | 23,002 | 21,371 | 23,384 | 21,528 | 22,481 | 23,644 | 25,512 | 23,556 | 24,037 | 24,857 |
| 2012 | 23,033 | 20,997 | 22,016 | 20,923 | 22,469 | 20,641 | 20,684 | 22,511 | 21,028 | 23,664 | 25,426 | 24,508 |
| 2013 | 23,230 | 22,590 | 22,636 | 19,651 | 21,438 | 22,159 | 23,562 | 20,950 | 21,189 | 23,172 | 24,288 | 24,948 |
| 2014 | 23,948 | 22,218 | 22,641 | 23,078 | 24,420 | 22,150 | 25,257 | 23,006 | 19,844 | 19,722 | 24,272 | 30,075 |
| 2015 | 26,151 | 24,134 | 26,292 | 25,379 | 24,186 | 23,424 | 25,498 | 26,439 | 26,069 | 26,769 | 28,042 | 28,898 |
| 2016 | 27,198 | 23,647 | 26,084 | 21,393 | 22,538 | 22,583 | 24,108 | 23,057 | 22,363 | 25,871 | 25,758 | 27,699 |
| 2017 | 25,597 | 23,154 | 22,479 | 21,813 | 22,677 | 22,018 | 23,765 | 19,708 | 16,995 | 25,158 | 26,517 | 26,705 |
| 2018 | 24,761 | 19,884 | 25,076 | 22,716 | 22,187 | 22,384 | 24,895 | 22,378 | 22,598 | 27,067 | 26,436 | 26,384 |
| 2019 | 28,553 | 23,685 | 27,784 | 21,804 | 24,164 | 24,051 | 23,646 | 23,935 | 20,398 | 25,577 | 26,045 | 26,809 |
| 2020 | 24,753 | 22,855 | 24,001 | 17,135 | 15,257 | 16,722 | 17,557 | 21,103 | 21,736 | 22,640 | 22,440 | 23,505 |
| 2021 | 23,107 | 14,443 | 19,872 | 22,141 | 23,534 | 22,387 | 22,477 | 23,427 | 22,065 | 22,742 | 24,207 | 27,760 |
| 2022 | 22,740 | 20,775 | 23,377 | 23,118 | 27,360 | 24,242 | 24,904 | 25,832 | 24,735 | 24,077 | 27,103 | 25,411 |
| 2023 | 23,180 | 22,431 | 26,835 | 24,809 | 24,457 | 25,119 | 25,707 | 23,702 | 25,884 | 24,353 | 24,887 | 29,626 |
| 2024 | 25,832 | |||||||||||
| - = No Data Reported; -- = Not Applicable; NA = Not Available; W = Withheld to avoid disclosure of individual company data. |
| Release Date: 3/29/2024 |
| Next Release Date: 4/30/2024 |