|
Download Data (XLS File) |
|
||||||||
|
||||||||
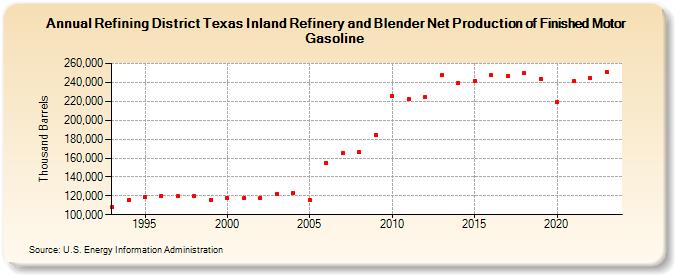
| Refining District Texas Inland Refinery and Blender Net Production of Finished Motor Gasoline (Thousand Barrels) | ||||||||
| Decade | Year-0 | Year-1 | Year-2 | Year-3 | Year-4 | Year-5 | Year-6 | Year-7 | Year-8 | Year-9 |
|---|---|---|---|---|---|---|---|---|---|---|
| 1990's | 107,860 | 115,605 | 118,754 | 120,195 | 119,296 | 119,714 | 115,980 | |||
| 2000's | 117,454 | 117,900 | 117,704 | 121,928 | 122,849 | 115,652 | 155,047 | 165,049 | 166,202 | 184,480 |
| 2010's | 226,077 | 222,068 | 224,870 | 247,598 | 239,592 | 241,763 | 247,370 | 246,933 | 249,636 | 244,077 |
| 2020's | 219,475 | 241,055 | 244,415 | 251,573 |
| - = No Data Reported; -- = Not Applicable; NA = Not Available; W = Withheld to avoid disclosure of individual company data. |
| Release Date: 8/30/2024 |
| Next Release Date: 8/29/2025 |