|
Download Data (XLS File) |
|
||||||||
|
||||||||
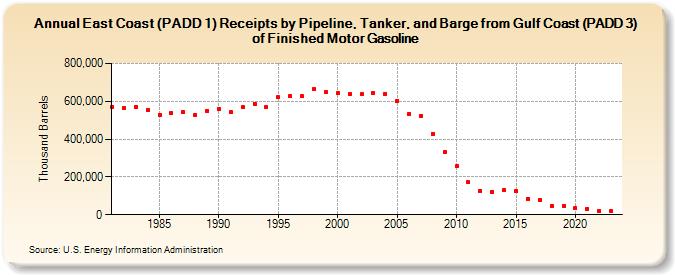
| East Coast (PADD 1) Receipts by Pipeline, Tanker, and Barge from Gulf Coast (PADD 3) of Finished Motor Gasoline (Thousand Barrels) | ||||||||
| Decade | Year-0 | Year-1 | Year-2 | Year-3 | Year-4 | Year-5 | Year-6 | Year-7 | Year-8 | Year-9 |
|---|---|---|---|---|---|---|---|---|---|---|
| 1980's | 571,234 | 562,878 | 568,851 | 554,594 | 529,345 | 539,128 | 543,184 | 529,303 | 550,981 | |
| 1990's | 561,569 | 541,996 | 568,616 | 587,088 | 568,232 | 620,317 | 629,138 | 625,490 | 664,287 | 646,985 |
| 2000's | 642,316 | 639,258 | 635,930 | 644,854 | 639,678 | 603,181 | 533,139 | 523,475 | 429,058 | 330,188 |
| 2010's | 255,735 | 171,446 | 127,002 | 122,451 | 128,714 | 123,367 | 84,827 | 80,145 | 48,043 | 47,747 |
| 2020's | 35,777 | 31,712 | 20,560 | 18,625 |
| - = No Data Reported; -- = Not Applicable; NA = Not Available; W = Withheld to avoid disclosure of individual company data. |
| Release Date: 3/29/2024 |
| Next Release Date: 8/30/2024 |