|
Download Data (XLS File) |
|
||||||||
|
||||||||
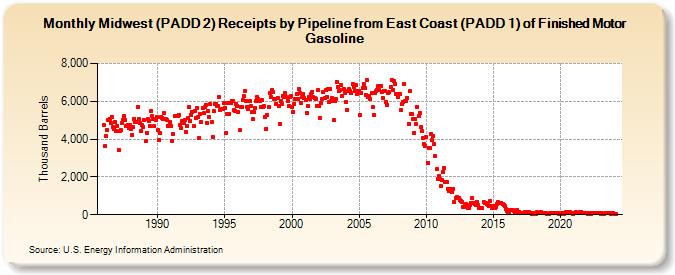
| Midwest (PADD 2) Receipts by Pipeline from East Coast (PADD 1) of Finished Motor Gasoline (Thousand Barrels) | ||||||||
| Year | Jan | Feb | Mar | Apr | May | Jun | Jul | Aug | Sep | Oct | Nov | Dec |
|---|---|---|---|---|---|---|---|---|---|---|---|---|
| 1986 | 4,752 | 3,621 | 4,139 | 4,469 | 5,027 | 5,048 | 4,837 | 5,187 | 4,617 | 4,554 | 4,901 | 4,405 |
| 1987 | 4,717 | 3,418 | 4,433 | 4,491 | 4,877 | 5,009 | 5,205 | 4,998 | 4,674 | 4,771 | 4,595 | 4,756 |
| 1988 | 4,518 | 4,213 | 4,648 | 5,085 | 4,928 | 4,892 | 5,718 | 5,046 | 4,837 | 4,425 | 4,734 | 4,633 |
| 1989 | 4,986 | 3,883 | 4,347 | 5,037 | 4,967 | 4,683 | 5,483 | 5,206 | 5,085 | 4,678 | 5,019 | 5,161 |
| 1990 | 4,469 | 3,966 | 4,300 | 5,148 | 5,120 | 5,069 | 5,393 | 5,055 | 5,026 | 4,717 | 4,700 | 4,908 |
| 1991 | 4,688 | 3,907 | 4,245 | 5,209 | 5,196 | 5,248 | 5,232 | 5,290 | 4,746 | 4,567 | 4,977 | 4,838 |
| 1992 | 4,984 | 4,378 | 4,667 | 5,101 | 5,720 | 4,962 | 5,253 | 5,407 | 4,671 | 5,492 | 5,106 | 5,659 |
| 1993 | 5,177 | 4,076 | 5,338 | 4,891 | 5,652 | 5,373 | 5,710 | 5,824 | 4,868 | 5,469 | 5,185 | 5,840 |
| 1994 | 4,905 | 4,098 | 5,463 | 5,835 | 5,878 | 5,777 | 5,762 | 6,205 | 5,552 | 5,602 | 5,590 | 5,884 |
| 1995 | 5,667 | 4,301 | 5,303 | 5,909 | 5,329 | 5,923 | 6,008 | 5,996 | 5,513 | 5,512 | 5,879 | 5,729 |
| 1996 | 5,428 | 4,480 | 5,714 | 5,675 | 6,050 | 6,255 | 6,568 | 6,035 | 5,722 | 5,575 | 6,008 | 5,733 |
| 1997 | 5,415 | 5,053 | 5,413 | 5,632 | 6,022 | 6,250 | 6,103 | 6,036 | 5,677 | 6,053 | 5,712 | 5,737 |
| 1998 | 5,162 | 4,560 | 5,292 | 5,674 | 6,440 | 6,220 | 6,605 | 6,475 | 6,105 | 6,098 | 5,870 | 6,153 |
| 1999 | 5,744 | 4,808 | 6,029 | 5,851 | 6,301 | 6,230 | 6,447 | 6,225 | 6,040 | 5,747 | 6,234 | 6,278 |
| 2000 | 5,697 | 5,447 | 5,882 | 6,146 | 6,376 | 6,131 | 6,654 | 6,422 | 5,902 | 6,229 | 6,397 | 6,194 |
| 2001 | 6,071 | 5,397 | 5,756 | 6,221 | 6,122 | 6,378 | 6,491 | 6,201 | 6,160 | 6,126 | 5,775 | 6,591 |
| 2002 | 5,759 | 5,129 | 5,903 | 6,147 | 6,471 | 6,156 | 6,591 | 6,247 | 6,651 | 5,939 | 6,652 | 6,023 |
| 2003 | 6,163 | 4,989 | 6,021 | 6,130 | 7,042 | 6,775 | 6,523 | 6,582 | 6,852 | 6,272 | 6,641 | 6,452 |
| 2004 | 5,969 | 5,523 | 6,535 | 6,657 | 6,544 | 6,423 | 6,909 | 6,752 | 6,540 | 6,854 | 6,388 | 6,548 |
| 2005 | 6,547 | 5,255 | 6,441 | 6,703 | 6,904 | 6,682 | 6,342 | 7,118 | 6,215 | 6,304 | 6,121 | 6,428 |
| 2006 | 5,674 | 5,299 | 6,430 | 6,523 | 6,611 | 6,808 | 6,606 | 6,811 | 6,510 | 6,170 | 6,548 | 6,538 |
| 2007 | 5,968 | 5,821 | 6,459 | 6,485 | 6,759 | 7,119 | 6,616 | 7,077 | 6,939 | 6,401 | 6,391 | 6,201 |
| 2008 | 6,367 | 5,531 | 5,857 | 5,988 | 6,903 | 6,037 | 6,022 | 6,189 | 4,788 | 6,541 | 5,352 | 5,320 |
| 2009 | 5,069 | 4,315 | 5,038 | 4,776 | 5,703 | 5,239 | 5,386 | 4,627 | 4,402 | 4,050 | 3,753 | 3,659 |
| 2010 | 4,099 | 2,752 | 3,551 | 3,531 | 4,292 | 3,931 | 4,152 | 3,723 | 3,117 | 2,418 | 1,894 | 2,040 |
| 2011 | 1,914 | 1,512 | 1,836 | 2,272 | 2,476 | 1,709 | 1,729 | 1,385 | 1,232 | 1,383 | 1,270 | 1,199 |
| 2012 | 1,384 | 668 | 871 | 962 | 887 | 888 | 779 | 721 | 698 | 417 | 461 | 572 |
| 2013 | 415 | 344 | 346 | 539 | 635 | 873 | 627 | 562 | 521 | 697 | 505 | 356 |
| 2014 | 365 | 339 | 341 | 680 | 642 | 635 | 550 | 538 | 460 | 727 | 436 | 379 |
| 2015 | 435 | 347 | 412 | 574 | 653 | 617 | 596 | 634 | 562 | 507 | 441 | 280 |
| 2016 | 192 | 147 | 155 | 253 | 224 | 223 | 219 | 165 | 95 | 250 | 112 | 164 |
| 2017 | 79 | 103 | 107 | 114 | 132 | 108 | 131 | 84 | 126 | 88 | 60 | 85 |
| 2018 | 60 | 39 | 50 | 121 | 100 | 95 | 130 | 115 | 95 | 92 | 80 | 69 |
| 2019 | 63 | 32 | 81 | 111 | 80 | 94 | 113 | 112 | 70 | 105 | 47 | 84 |
| 2020 | 64 | 64 | 73 | 62 | 112 | 129 | 136 | 138 | 122 | 98 | 73 | 63 |
| 2021 | 87 | 70 | 123 | 98 | 83 | 129 | 161 | 82 | 65 | 111 | 81 | 70 |
| 2022 | 43 | 43 | 79 | 64 | 83 | 76 | 73 | 106 | 73 | 92 | 92 | 92 |
| 2023 | 58 | 73 | 45 | 57 | 106 | 95 | 103 | 97 | 66 | 55 | 69 | 68 |
| 2024 | 59 | |||||||||||
| - = No Data Reported; -- = Not Applicable; NA = Not Available; W = Withheld to avoid disclosure of individual company data. |
| Release Date: 3/29/2024 |
| Next Release Date: 4/30/2024 |