|
Download Data (XLS File) |
|
||||||||
|
||||||||
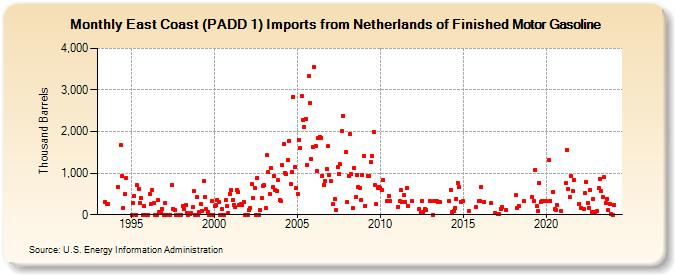
| East Coast (PADD 1) Imports from Netherlands of Finished Motor Gasoline (Thousand Barrels) | ||||||||
| Year | Jan | Feb | Mar | Apr | May | Jun | Jul | Aug | Sep | Oct | Nov | Dec |
|---|---|---|---|---|---|---|---|---|---|---|---|---|
| 1993 | 301 | 250 | 266 | |||||||||
| 1994 | 675 | 1,673 | 930 | 168 | 487 | 872 | ||||||
| 1995 | 0 | 284 | 449 | 0 | 707 | 628 | 283 | 399 | 0 | 201 | 0 | 0 |
| 1996 | 0 | 505 | 257 | 593 | 280 | 0 | 0 | 364 | 54 | 38 | 143 | 0 |
| 1997 | 273 | 0 | 0 | 0 | 0 | 725 | 138 | 120 | 0 | 0 | 0 | 0 |
| 1998 | 0 | 209 | 140 | 225 | 46 | 0 | 26 | 31 | 178 | 570 | 0 | 427 |
| 1999 | 0 | 65 | 255 | 87 | 800 | 426 | 134 | 54 | 0 | 0 | 334 | 0 |
| 2000 | 206 | 225 | 357 | 302 | 3 | 129 | 0 | 0 | 352 | 202 | 32 | 508 |
| 2001 | 591 | 350 | 241 | 176 | 595 | 550 | 233 | 264 | 237 | 312 | 0 | 0 |
| 2002 | 0 | 112 | 165 | 731 | 395 | 634 | 0 | 890 | 0 | 107 | 404 | 696 |
| 2003 | 707 | 158 | 1,430 | 1,019 | 491 | 1,124 | 663 | 926 | 588 | 577 | 823 | 355 |
| 2004 | 318 | 1,187 | 1,691 | 998 | 979 | 1,322 | 1,768 | 744 | 1,028 | 2,842 | 1,159 | 650 |
| 2005 | 505 | 1,808 | 1,606 | 2,858 | 2,289 | 2,121 | 2,307 | 1,185 | 3,328 | 2,685 | 1,342 | 1,618 |
| 2006 | 3,557 | 1,653 | 1,061 | 1,835 | 1,881 | 1,847 | 939 | 711 | 800 | 1,103 | 1,646 | 949 |
| 2007 | 814 | 251 | 378 | 117 | 1,143 | 990 | 1,212 | 2,002 | 2,377 | 1,498 | ||
| 2008 | 304 | 940 | 1,935 | 970 | 157 | 1,130 | 419 | 953 | 669 | 646 | 344 | 962 |
| 2009 | 1,417 | 217 | 943 | 924 | 1,258 | 1,424 | 1,999 | 708 | 249 | 650 | 658 | |
| 2010 | 632 | 600 | 833 | 320 | 455 | 328 | ||||||
| 2011 | 186 | 326 | 586 | 313 | 476 | 311 | 638 | 219 | 326 | |||
| 2012 | 149 | 53 | 331 | 54 | 149 | 124 | ||||||
| 2013 | 320 | 4 | 329 | 320 | 313 | 311 | ||||||
| 2014 | 327 | 601 | 75 | 90 | 166 | 384 | 770 | 658 | 307 | |||
| 2015 | 321 | 100 | 181 | 329 | ||||||||
| 2016 | 328 | 668 | 314 | 286 | 37 | |||||||
| 2017 | 23 | 7 | 144 | 182 | 121 | |||||||
| 2018 | 463 | 162 | 213 | 324 | ||||||||
| 2019 | 423 | 326 | 1,084 | 205 | 85 | 766 | 313 | 321 | 325 | |||
| 2020 | 321 | 1,326 | 331 | 557 | 130 | 112 | 238 | 78 | ||||
| 2021 | 767 | 1,563 | 623 | 421 | 928 | 574 | 838 | |||||
| 2022 | 265 | 158 | 135 | 520 | 791 | 289 | 158 | 593 | 64 | 379 | 59 | |
| 2023 | 95 | 639 | 865 | 564 | 420 | 896 | 276 | 389 | 108 | 267 | 18 | |
| 2024 | 3 | |||||||||||
| - = No Data Reported; -- = Not Applicable; NA = Not Available; W = Withheld to avoid disclosure of individual company data. |
| Release Date: 3/29/2024 |
| Next Release Date: 4/30/2024 |