|
Download Data (XLS File) |
|
||||||||
|
||||||||
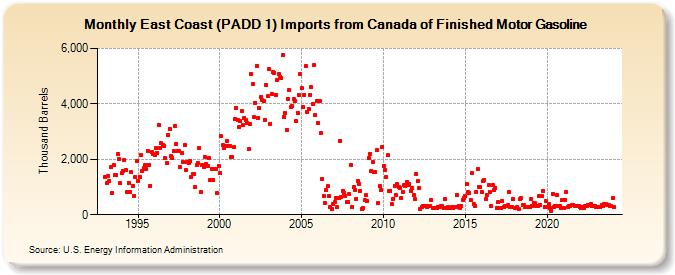
| East Coast (PADD 1) Imports from Canada of Finished Motor Gasoline (Thousand Barrels) | ||||||||
| Year | Jan | Feb | Mar | Apr | May | Jun | Jul | Aug | Sep | Oct | Nov | Dec |
|---|---|---|---|---|---|---|---|---|---|---|---|---|
| 1993 | 1,372 | 1,138 | 1,397 | 1,223 | 1,716 | 786 | 1,803 | 1,421 | 1,450 | 2,190 | 2,006 | 1,148 |
| 1994 | 1,522 | 1,588 | 1,973 | 1,605 | 824 | 1,159 | 833 | 1,527 | 1,052 | 677 | 1,366 | 1,924 |
| 1995 | 1,210 | 1,374 | 2,148 | 1,588 | 1,683 | 1,781 | 1,658 | 2,311 | 1,807 | 1,053 | 2,253 | 2,199 |
| 1996 | 2,138 | 2,400 | 2,240 | 3,243 | 2,424 | 2,586 | 2,532 | 2,484 | 2,028 | 1,868 | 2,883 | 3,093 |
| 1997 | 2,101 | 2,053 | 2,283 | 3,218 | 2,569 | 2,298 | 2,286 | 1,712 | 2,237 | 1,905 | 2,511 | 1,608 |
| 1998 | 1,903 | 1,862 | 1,936 | 1,356 | 1,452 | 1,456 | 991 | 1,795 | 1,862 | 2,413 | 815 | 1,791 |
| 1999 | 1,718 | 2,099 | 1,833 | 1,775 | 2,061 | 1,243 | 1,650 | 1,237 | 1,644 | 1,641 | 779 | 1,752 |
| 2000 | 1,501 | 2,829 | 2,500 | 2,420 | 2,473 | 2,659 | 2,477 | 2,482 | 2,072 | 2,082 | 2,440 | 3,458 |
| 2001 | 3,849 | 3,426 | 3,159 | 3,378 | 3,759 | 3,233 | 3,489 | 3,433 | 3,312 | 2,354 | 3,255 | 5,064 |
| 2002 | 4,706 | 3,513 | 4,047 | 5,381 | 3,489 | 3,861 | 4,250 | 4,140 | 4,110 | 3,417 | 4,684 | 4,266 |
| 2003 | 5,262 | 3,283 | 4,358 | 5,133 | 5,127 | 4,335 | 4,867 | 5,072 | 4,984 | 4,943 | 5,748 | 3,538 |
| 2004 | 3,652 | 3,059 | 4,181 | 4,488 | 3,870 | 3,914 | 4,166 | 4,101 | 3,369 | 3,663 | 4,318 | 5,061 |
| 2005 | 4,568 | 3,879 | 4,329 | 5,360 | 3,723 | 3,814 | 4,327 | 4,596 | 4,010 | 5,389 | 3,606 | 4,105 |
| 2006 | 3,324 | 4,090 | 2,934 | 1,304 | 680 | 424 | 881 | 1,020 | 673 | 273 | 219 | 398 |
| 2007 | 446 | 616 | 272 | 599 | 2,675 | 636 | 852 | 798 | 675 | 449 | 462 | 753 |
| 2008 | 1,794 | 291 | 984 | 891 | 574 | 1,233 | 1,121 | 867 | 223 | 243 | 516 | 700 |
| 2009 | 502 | 2,035 | 2,201 | 1,592 | 1,899 | 1,549 | 1,527 | 2,322 | 409 | 1,031 | 880 | 2,433 |
| 2010 | 1,767 | 1,624 | 1,354 | 2,139 | 851 | 868 | 393 | 578 | 1,053 | 726 | 1,107 | 1,003 |
| 2011 | 981 | 614 | 810 | 1,085 | 1,048 | 1,185 | 1,068 | 1,095 | 850 | 959 | 723 | 557 |
| 2012 | 1,473 | 1,206 | 956 | 215 | 264 | 297 | 329 | 332 | 291 | 300 | 299 | 527 |
| 2013 | 244 | 227 | 246 | 237 | 287 | 262 | 311 | 322 | 249 | 571 | 239 | 266 |
| 2014 | 242 | 229 | 269 | 247 | 267 | 287 | 713 | 308 | 254 | 321 | 533 | 617 |
| 2015 | 658 | 1,105 | 815 | 768 | 539 | 1,493 | 391 | 305 | 823 | 1,656 | 991 | 994 |
| 2016 | 826 | 1,202 | 1,260 | 567 | 722 | 1,080 | 837 | 321 | 1,077 | 887 | 967 | 260 |
| 2017 | 454 | 241 | 260 | 478 | 289 | 304 | 316 | 339 | 829 | 273 | 268 | 549 |
| 2018 | 259 | 236 | 261 | 211 | 550 | 588 | 334 | 337 | 275 | 290 | 262 | 261 |
| 2019 | 552 | 323 | 435 | 419 | 309 | 319 | 668 | 366 | 665 | 841 | 265 | 506 |
| 2020 | 266 | 394 | 225 | 152 | 763 | 283 | 320 | 705 | 309 | 300 | 232 | 542 |
| 2021 | 260 | 548 | 828 | 274 | 306 | 328 | 348 | 368 | 325 | 320 | 300 | 314 |
| 2022 | 266 | 255 | 275 | 260 | 323 | 318 | 351 | 359 | 383 | 314 | 299 | 320 |
| 2023 | 288 | 279 | 293 | 275 | 341 | 324 | 382 | 395 | 343 | 354 | 307 | 300 |
| 2024 | 608 | |||||||||||
| - = No Data Reported; -- = Not Applicable; NA = Not Available; W = Withheld to avoid disclosure of individual company data. |
| Release Date: 3/29/2024 |
| Next Release Date: 4/30/2024 |