|
Download Data (XLS File) |
|
||||||||
|
||||||||
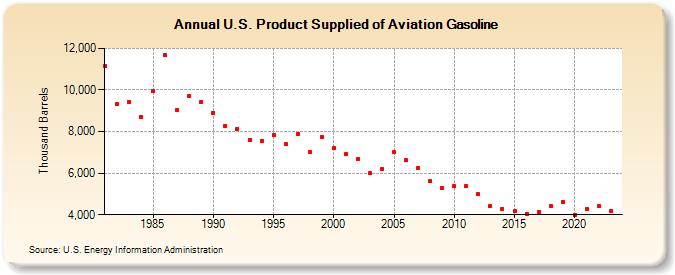
| U.S. Product Supplied of Aviation Gasoline (Thousand Barrels) | ||||||||
| Decade | Year-0 | Year-1 | Year-2 | Year-3 | Year-4 | Year-5 | Year-6 | Year-7 | Year-8 | Year-9 |
|---|---|---|---|---|---|---|---|---|---|---|
| 1980's | 11,147 | 9,307 | 9,444 | 8,692 | 9,969 | 11,673 | 9,041 | 9,705 | 9,427 | |
| 1990's | 8,910 | 8,265 | 8,133 | 7,606 | 7,555 | 7,841 | 7,400 | 7,864 | 7,032 | 7,760 |
| 2000's | 7,188 | 6,921 | 6,682 | 5,987 | 6,189 | 7,006 | 6,626 | 6,258 | 5,603 | 5,261 |
| 2010's | 5,358 | 5,360 | 4,975 | 4,429 | 4,298 | 4,188 | 4,054 | 4,150 | 4,436 | 4,633 |
| 2020's | 4,002 | 4,269 | 4,419 | 4,200 |
| - = No Data Reported; -- = Not Applicable; NA = Not Available; W = Withheld to avoid disclosure of individual company data. |
| Release Date: 3/29/2024 |
| Next Release Date: 8/30/2024 |